When Americans Trust Elections, They Are More Likely To Vote
Up to 5 million fewer votes were cast in 2024 due to decreased voter confidence in elections—showing what’s at stake in rebuilding a healthy democracy
In This Resource
Americans across the political spectrum agree on some core beliefs about democracy, even in times of great polarization. When States United asked people a year ago what “democracy” means to them, majorities from all backgrounds said that democracy is, first and foremost, about having an equal say in elections. Americans believe in free, fair, and secure elections—and it is far more important to them that every citizen’s vote counts rather than having their preferred candidate win.
New research from States United backs up a simple but critical truth: if you have confidence in elections, you vote.
Analyzing the verified voting records of the 2024 general election, alongside original States United polling, we set out to better understand the relationship between voters’ confidence in elections and their participation at the polls. What makes voters turn out to vote? Using voter file data, we identified which Americans voted in the November 2024 elections and compared that to the level of confidence those same individuals expressed before Election Day about whether their vote would count as they intended.
This research marks the first time, to the best of our knowledge, that the relationship between voter confidence and voter turnout has been shown using verified voting data.
The new States United report finds:
- People who expressed higher levels of confidence that their vote would be counted as intended were more likely to vote. This pattern was consistent across partisan groups and most prominent among independents.
- If Americans felt more confident about the security of the 2024 election, turnout could have increased by 3.0-3.7 percentage points.
- If all Americans felt the highest levels of confidence going into November 2024, as many as 4.7-5.7 million more voters may have cast a ballot.
- These margins are enough to decide election outcomes, including pivotal elections coming up in 2025 and 2026.
This research comes at a crucial moment, as we have seen how dramatically voter confidence can shift. After the 2024 election, States United polling showed that a sudden decline in attacks on election accuracy led to more voter confidence that their ballots were counted correctly.
Political elites hold great sway over Americans’ views on how voters feel about the act of voting. So when Election Deniers use tactics to destabilize our elections system—whether by attacking election accuracy, refusing to certify results, or filing frivolous lawsuits to challenge them—they destroy voter confidence in the voting process. And when voters lose confidence, as this new research shows, they are less likely to turn out.
The good news is that voters are greatly reassured about the fairness, accuracy, and security of our elections when they know more about how those elections are run. This new research highlights the urgency and importance of pro-democracy officials conveying to Americans that our elections are free, fair, and secure.
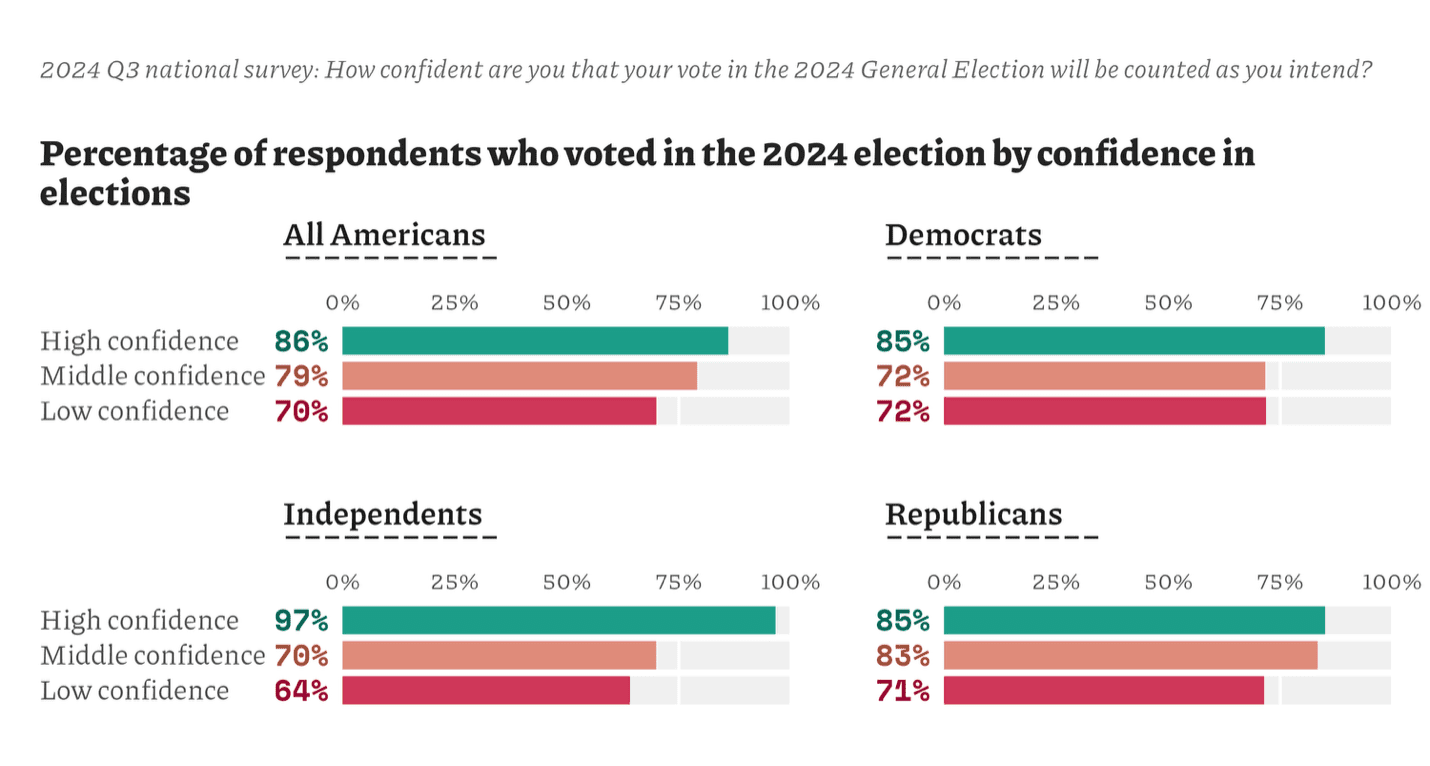
In October of 2024, we asked Americans: “How confident are you that your vote in the 2024 General Election will be counted as you intend?” We matched survey responses to voter file data, which allows us to see which of our respondents cast a ballot in the 2024 election. We did this so we could see how confidence in elections, measured before Election Day, influenced turnout.
As shown below, people who expressed higher levels of confidence that their vote was counted as intended were more likely to vote. This pattern is consistent across partisan groups.
We estimate that if all Americans felt the highest level of confidence in elections, then turnout would have been between 3 and 3.7 percentage points higher. (The former estimate is based on a model that includes a standard array of control variables, while the latter is based on a model that includes no control variables.)
In more concrete terms, that means that between 4.7 and 5.7 million Americans didn’t vote who might otherwise have done so had they felt more positively about American elections.
Data on confidence and other predictors of turnout are taken from a States United survey based on 1,550 interviews conducted on the internet of U.S. adults. The analysis was completed based on 1,140 U.S. adults whose survey responses could be matched to voter file data. Participants were drawn from YouGov’s online panel and were interviewed between October 10 – 16, 2024. Respondents were selected to be representative of American adults. Responses were additionally weighted to match population characteristics with respect to gender, age, race/ethnicity, education of registered voters, and U.S. Census region based on voter registration lists, the U.S. Census American Community Survey, and the U.S. Census Current Population Survey, as well as 2020 presidential vote. The margin of error for this survey is approximately ± 2.7 percentage points, though it is larger for the analysis of partisan subgroups described above. Therefore, sample estimates should differ from their expected value by less than the margin of error in 95% of all samples. This figure does not reflect non-sampling errors, including potential selection bias in panel participation or measurement error.
When answering our confidence in elections question, respondents could say that they were not at all confident, not too confident, somewhat confident, or very confident. We combined the two middle categories of confidence for ease of presentation; this change does not affect the results we report here.
Our estimates of how turnout levels shifted in response to confidence attitudes come from linear probability models where validated turnout, from a commercial voter file, serves as the dependent variable. In one model, we predict turnout using our measure of confidence. In a second, we predict it using confidence and a series of standard control variables: partisanship, ideological identity, gender identity, race and ethnicity, age, income, education, and interest in politics.
In keeping with best research practices, we classify independent voters who reported “leaning” toward either the Democratic or Republican parties as partisans. Therefore, we define “independents” as those respondents who professed no partisan attachments whatsoever.