Americans Trust State and Local Officials the Most in Running Elections
In This Resource
The more local the election official, the more Americans trust them to ensure that elections remain free, fair, and secure.
People say they trust their local elections officials the most, followed by their state officials, with national political officials having the lowest levels of trust to run elections.
In this country’s decentralized system, the U.S. Constitution gives state and local officials the most responsibilities over election administration. At a time when the Trump administration continues to push for more power in controlling the election process through executive action, lawsuits, and investigations, Americans align with the legal authority granted to the states.
States United partnered with YouGov on a national survey of 6,037 adults from Sept. 5 through Sept. 15, 2025, to better understand Americans’ views on this issue.
- Six in ten Americans report having either a great deal or a fair amount of trust in their local elections officials.
- The share of Americans who have either a great deal or a fair amount of trust in secretaries of state, governors, and attorney general is similar, but together are still lower than local officials.
- Trust in national officials is lower than for local and state officials when it comes to running elections, sometimes much lower.
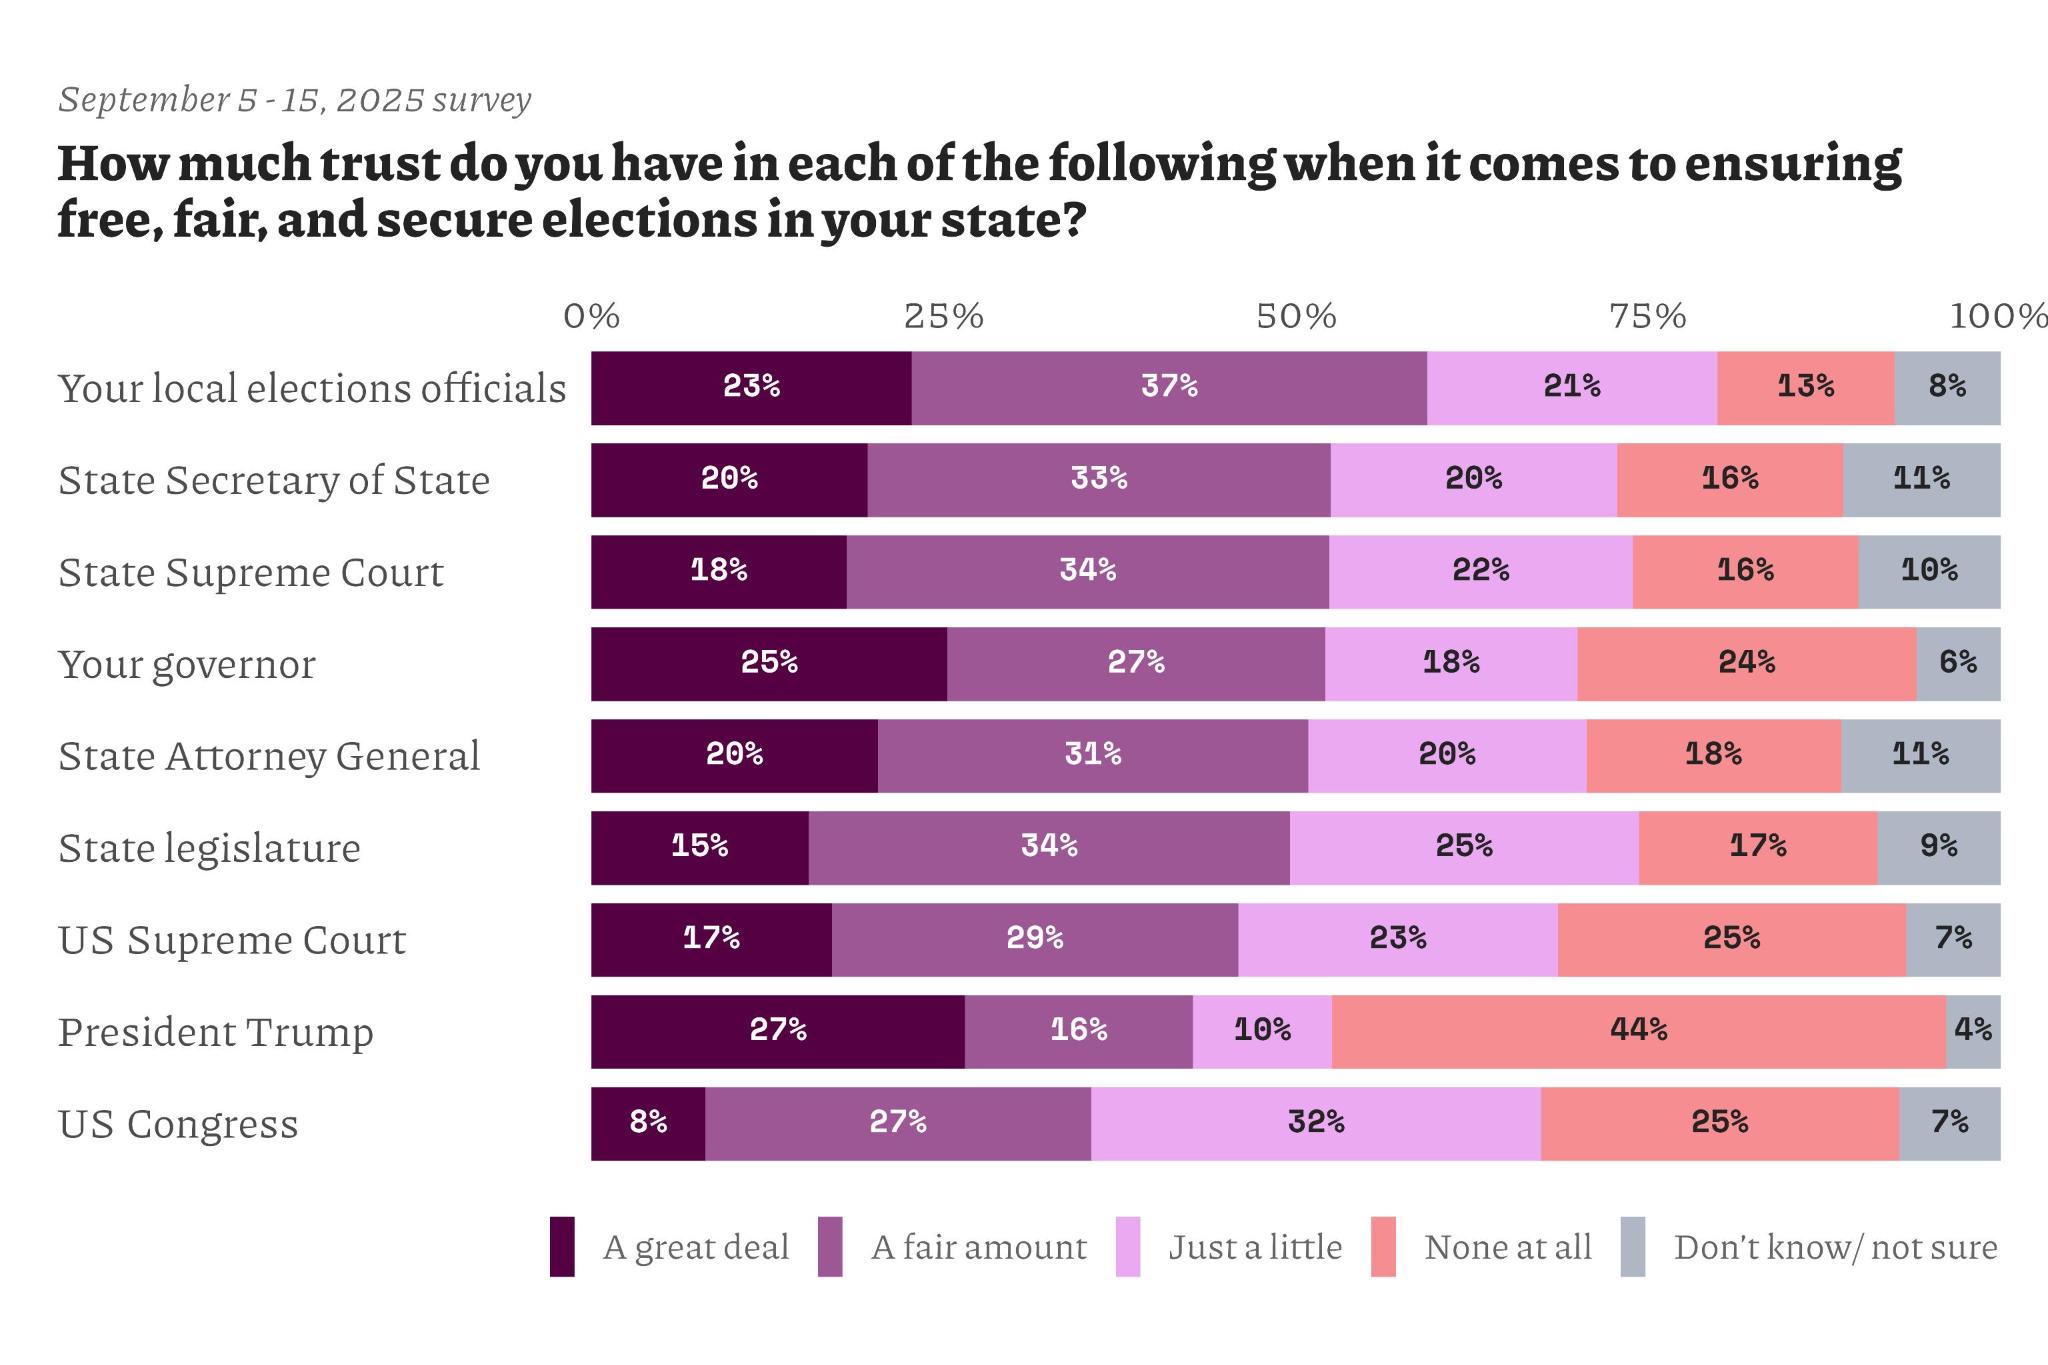
We asked Americans how much trust they have in the people and institutions that work to ensure our elections are free, fair, and secure. Americans were most likely to trust their local elections officials a great deal or fair amount (60%), compared to how much they trust their state’s secretary of state (53%), governor (52%), state attorney general (51%), President Trump (43%), or Congress (35%). Very few Americans (13%) had no trust at all in their local elections officials—the lowest level of “none at all” across the officials and institutions that run elections.
These data are taken from a States United survey based on 6,037 interviews conducted on the internet of U.S. adults. Participants were drawn from YouGov’s online panel and were interviewed from Sept. 5 to 15, 2025. Respondents were selected to be representative of American adults. Responses were additionally weighted to match population characteristics with respect to gender, age, race/ethnicity, education of registered voters, and U.S. Census region based on voter registration lists, the U.S. Census American Community Survey, and the U.S. Census Current Population Survey, as well as 2020 and 2024 presidential vote. The margin of error for this survey is approximately ± 1.4 percentage points, though it is larger for the analysis of partisan subgroups described above. Therefore, sample estimates should differ from their expected value by less than the margin of error in 95% of all samples. This figure does not reflect non-sampling errors, including potential selection bias in panel participation or measurement error.
In keeping with best research practices, we classify independent voters who reported “leaning” toward either the Democratic or Republican parties as partisans. Therefore, we define “independents” as those respondents who professed no partisan attachments whatsoever.
We used shorthand in the figure of results above to label some of the political figures and institutions to improve readability. The full text that respondents saw when answering these trust questions follows:
- The governor of your state
- The attorney general of your state
- Your state’s Secretary of State or your state’s election board
- Your local elections officials
- President Trump
- The U.S. Congress