Nearly 1 in 3 Americans Voted by Mail in 2024
States United analysis reveals that white voters, voters 65+, and overseas U.S. military voters are among the groups that relied significantly on voting by mail in the last presidential election.
When Americans exercise their right to vote, they have the option to cast their ballot in a variety of ways according to the laws of their state. Voting by mail is one of the most widely used and trusted methods of voting, offered by every state in the country in some form. Voting by mail is a secure and reliable way that U.S. citizens make their voices heard.
On March 31, 2026, President Trump signed an executive order that would bar the U.S. Postal Service from sending mail ballots to any voters not on a federal list. He also previously pledged to “get rid of mail-in ballots” entirely. But the U.S. Constitution gives states the power to decide how to run elections, including setting their policies for different voting methods based on what works for their communities.
States United sought to understand the use of mail voting today and the potential impact if it were not an option for voters. We examined the verified voting records of the 2024 general election and looked at the demographic breakdown of how Americans used this method of voting.
The results are clear: Tens of millions of Americans—from all backgrounds and regions of the country—use mail voting to participate in our democracy.
- Nearly 1 in 3 Americans (31%) voted by mail in the 2024 general election, accounting for more than 48 million votes.
- People of all demographics used mail voting. Some used it more than others:
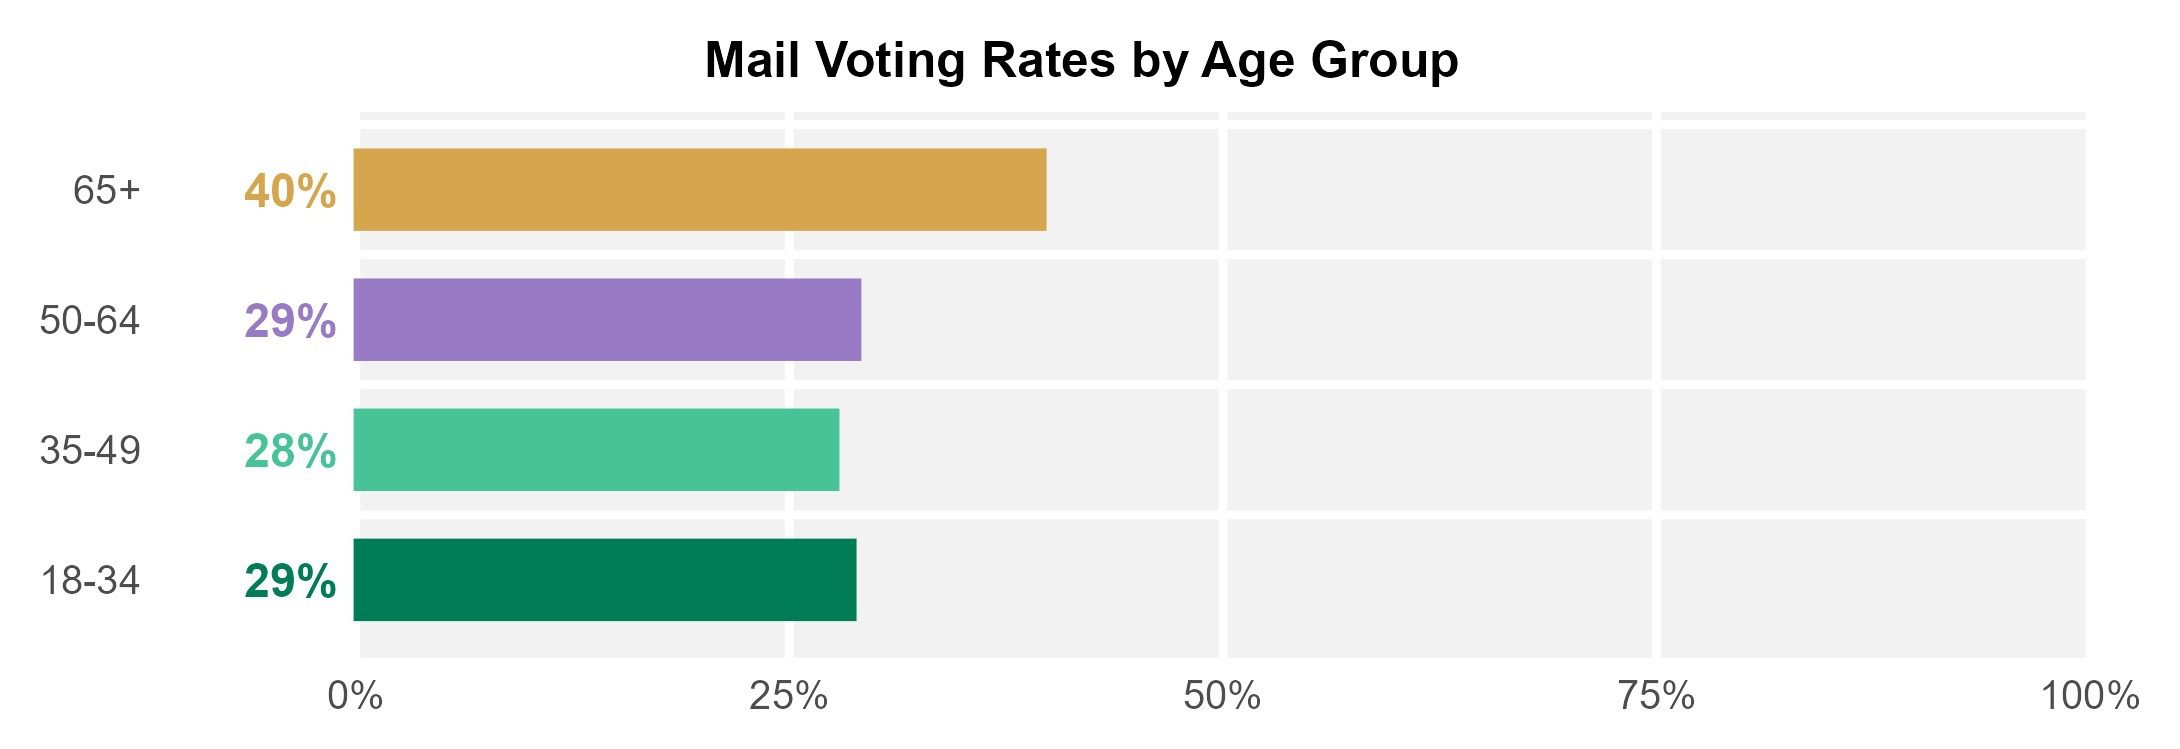
- Age: Voters ages 65+ were most likely to use mail voting. Mailed ballots accounted for almost 40% of votes cast by this group.
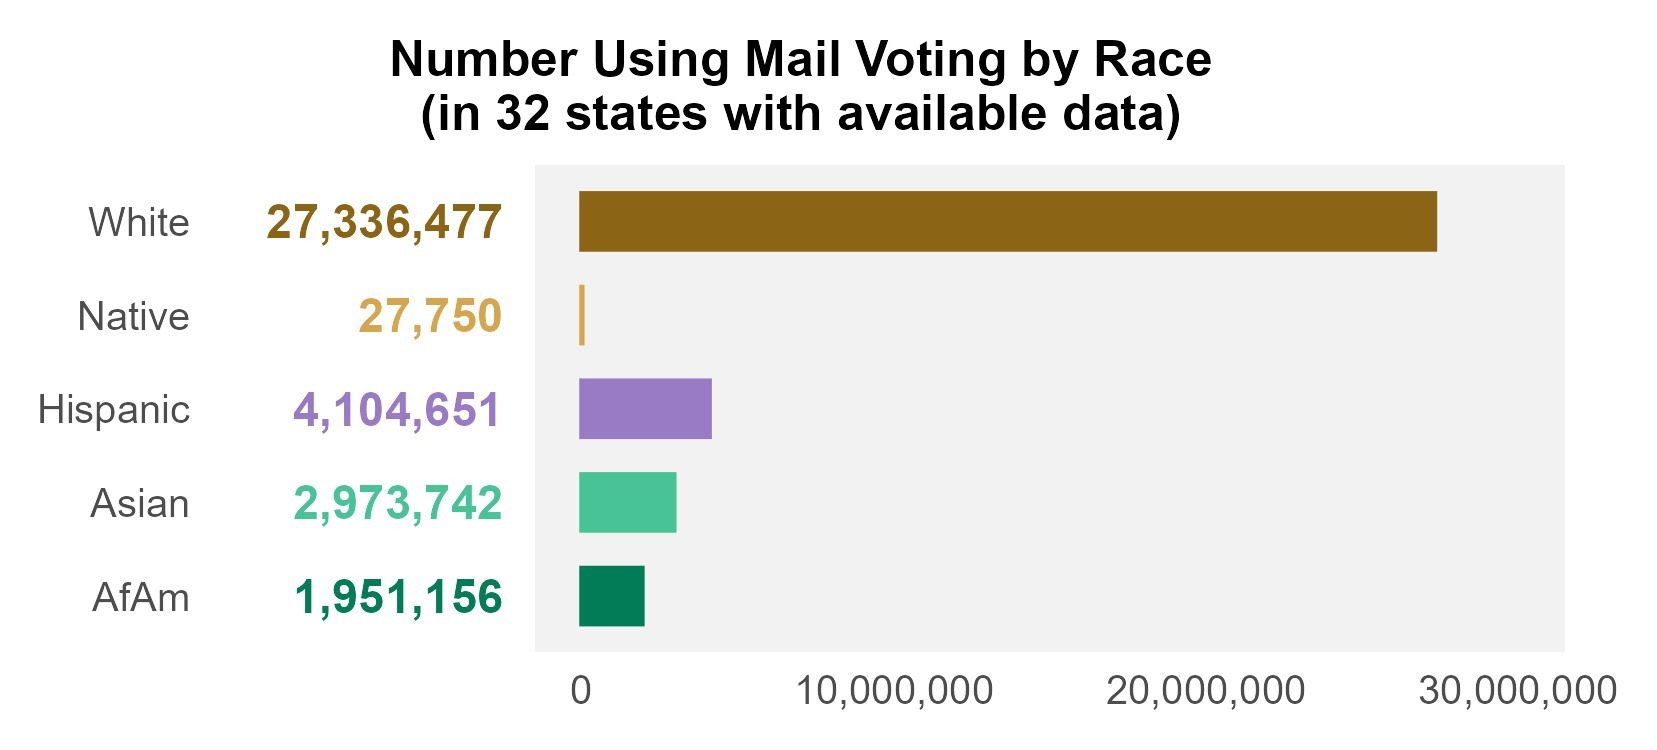
- Race: 1 in 3 white voters cast ballots by mail in 2024, totaling over 27 million votes. White voters cast the greatest number of mail ballots of all racial demographic groups.
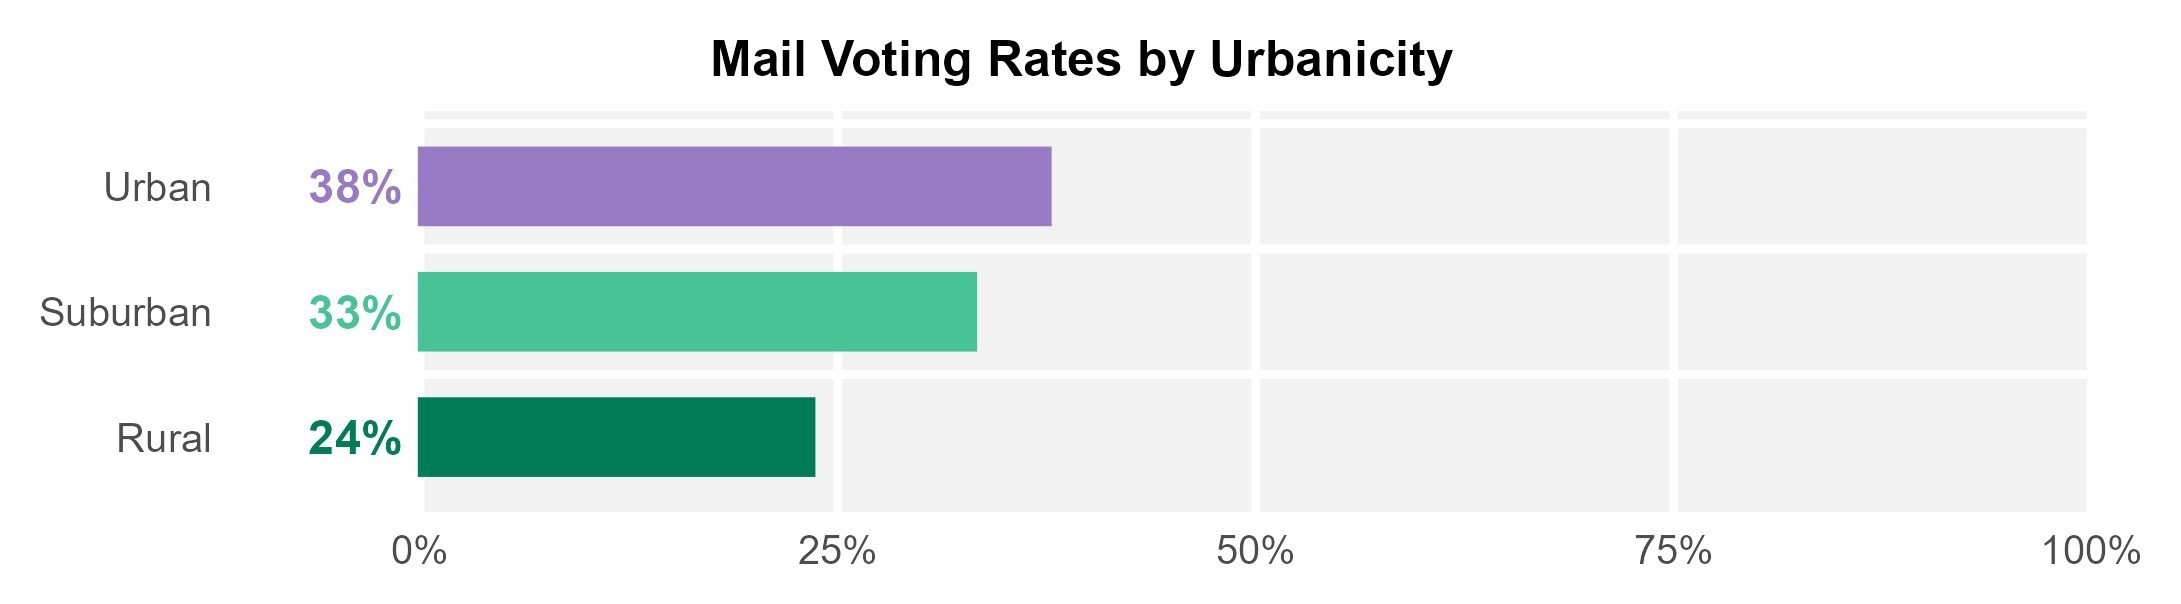
- Urbanicity: Voters in every geographic setting used mail ballots at high rates. Mailed ballots were cast by 1 in 3 suburban voters, 1 in 3 city voters, and 1 in 4 rural voters.
- Abroad: Hundreds of thousands of members of the U.S. military and U.S. citizens living abroad relied on mail ballots to cast their vote in 2024, sending 905,343 votes through the mail. Alabama and Florida were the states that received the largest number of mail ballots from U.S. citizens living and serving abroad.
- Party: Voters of every political affiliation cast ballots by mail in 2024. Both President Trump and Vice President Harris won multiple states in which the majority of ballots were cast by mail.
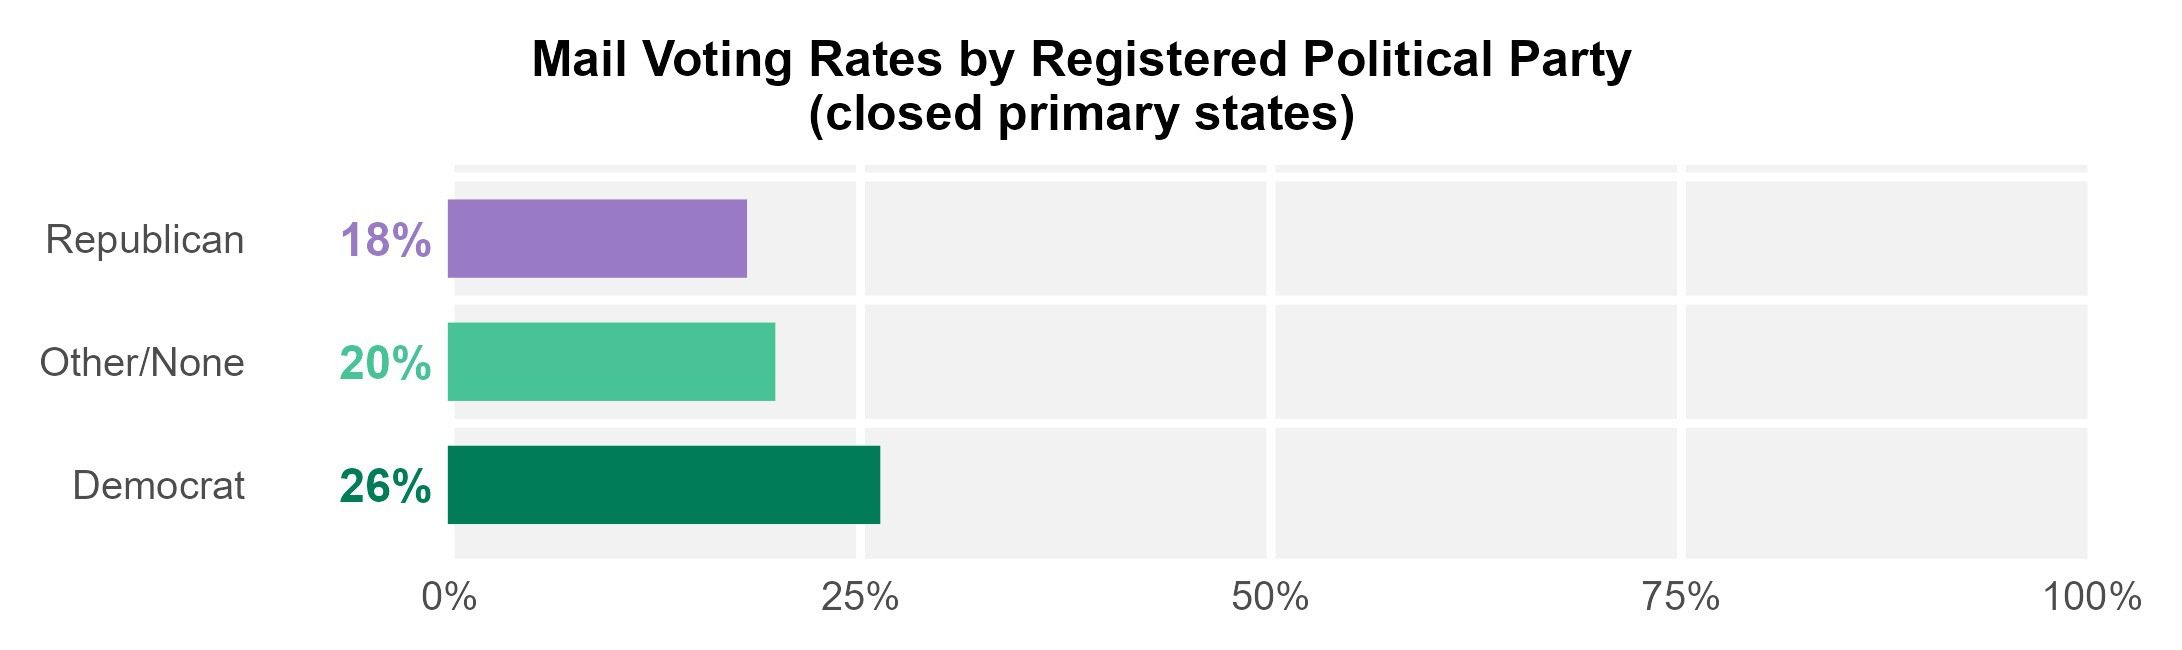
- About 1 in 4 registered Democrats and 1 in 5 registered Republicans voted by mail, as well as 1 in 5 voters who registered with other parties or with no party.
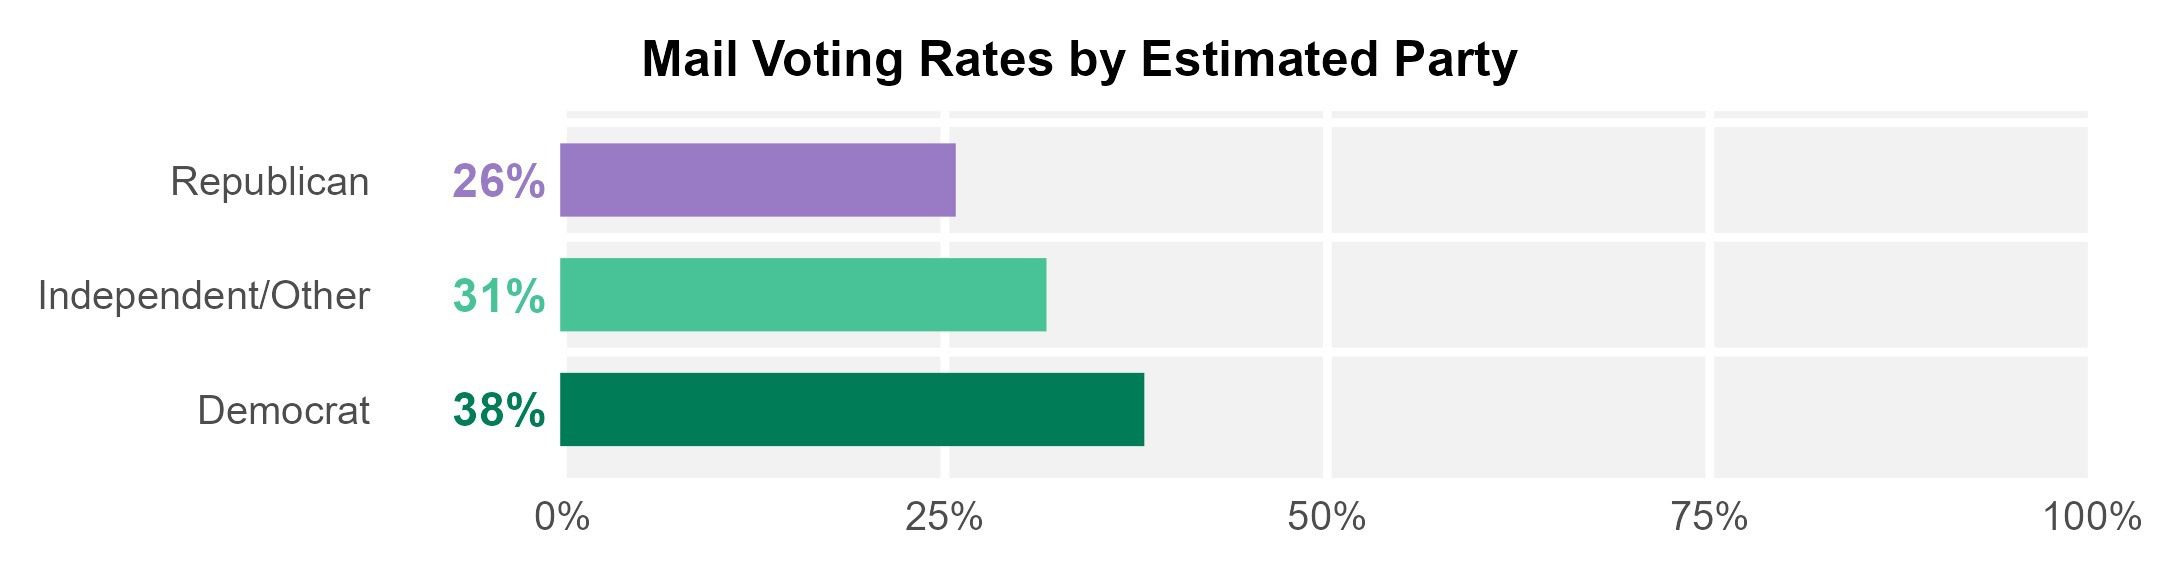
- If we consider the estimated party of voters (based on statistical modeling to include voters in states that don’t require party registration for primaries), more than 1 in 3 estimated Democrats, almost 1 in 4 estimated Republicans, and almost 1 in 3 estimated independents voted by mail.
- More than 1 in 3 registered Republicans voted by mail in five states and Washington, D.C. (CO, CA, WY, ME, NV, and DC).
- More than 1 in 3 registered Democrats voted by mail in seven states and Washington D.C. (CO, CA, WY, ME, NV, IA, and DC).
- About 1 in 4 registered Democrats and 1 in 5 registered Republicans voted by mail, as well as 1 in 5 voters who registered with other parties or with no party.
Note: These demographic findings are based on 32 states with available data. The analysis reflects vote type data for 113,841,164 voters out of the total 156,766,239 voters who cast ballots in the 2024 general election, or roughly 72% of all votes cast.
See Methodology for more details.
For every age group, at least 1 in 4 voters cast a ballot by mail in 2024. Voters ages 65+ were the most likely to vote by mail. These voters cast nearly 40% of their votes by mail.
White voters were the largest group of voters to cast votes by mail in 2024. About 1 in 3 white voters voted by mail, accounting for over 27 million votes in the states analyzed.
Americans chose to vote by mail in every type of geographical setting in the country. Nearly 1 in 4 rural voters, roughly 1 in 3 suburban voters, and just over 1 in 3 urban voters cast their ballot by mail.
Hundreds of thousands of members of the U.S. military and U.S. citizens living abroad relied on mail-in ballots in 2024. Often referred to as UOCAVA voters (Uniformed and Overseas Citizens Absentee Voting Act), these citizens accounted for 905,343 ballots cast in 2024.
The states with the largest number of ballots cast by members of the U.S. military and U.S. citizens abroad were Alabama (131,961), Florida (92,268), and California (82,549).
Registered Party
To assess mail voting trends by political affiliation, we first looked at available data from 10 states with closed primaries, where voters are required to register by party if they want to vote in a primary. (See Methodology for full list of states.)
Mail voting was popular among registered voters across all parties in 2024. It was a voting option used by about 1 in 4 Democrats, 1 in 5 Republicans, and 1 in 5 voters registered to other parties.
In five states and Washington D.C., more than 1 in 3 Republicans voted by mail (CO, CA, DC, WY, ME, NV).
In seven states and Washington D.C., more than 1 in 3 Democrats voted by mail (CO, CA, DC, WY, ME, NV, IA).
Estimated Party
For a fuller picture of vote type choices by voters across parties beyond what party registration can tell us, we examined vote type by estimated party—a modeled variable in the voter file that takes into account information about an individual to estimate which political party they likely identify with. We did this both because people often register as independent or unaffiliated even if they lean toward one political party or the other, and because some states do not have required party registration at all. This analysis by estimated party covers all 32 states that provide vote type data to the voter file, including those that do not have party registration.
The analysis confirmed that mail voting was popular among voters across all parties in 2024. It shows that when we include states without closed primaries in the analysis, we see even higher rates of mail voting.
About 1 in 4 estimated Republicans voted by mail, almost 1 in 3 estimated independents, and more than 1 in 3 estimated Democrats.
Registered Party vs. Estimated Party
Using both registered party and estimated party to understand mail voting rates can be useful for different reasons. Mail voting rates by registered party offer concrete, clear statistics that make intuitive sense to a variety of audiences. We can be 100% certain of someone’s registered party, as it is an objective statistic recorded by secretaries of state, based on someone’s voter registration.
Mail voting rates by estimated, or modeled, party are useful for two reasons:
- To include a greater number of states—32 in our analysis, as opposed to the 10 closed primary states for which we have data. Using estimated party allows us to include states that do not have party registration.
- To capture partisan leanings by those voters who may register independent but align with a party ideologically or in how they personally identify. There can be large numbers of these voters in open primary states, where party registration is not required to vote in a primary.
Each state sets its own laws about voting by mail. As a result, usage of mail voting varies by state.
Some states conduct their elections primarily by mail. Concentrated in the Western part of the country, these states allow no-excuse absentee voting: California, Colorado, Hawaii, Nevada, Oregon, Utah, Vermont, and Washington. All of these states, except OR and WA, also allow anyone the option to vote in person if they prefer. In OR and WA, there is no in-person voting. However, if voters need assistance with mail ballots they can go to certain voting offices for help.
On the other hand, several states offer more limited options for voting by mail and see far fewer ballots cast by mail as a result. Concentrated in the South and substantial portions of the Northeast, states that require a specific excuse for mail voting (such as being sick, over the age 65, or out of the county during an election) include: Alabama, Arkansas, Connecticut, Delaware, Indiana, Kentucky, Louisiana, Mississippi, Missouri, New Hampshire, South Carolina, Tennessee, Texas, and West Virginia.
Data were drawn from both the Election Administration and Voting Survey (EAVS) Comprehensive Report and the TargetSmart voter file accessed via Civis. In states where in-person or vote-by-mail EAVS data was incomplete (Alabama, Connecticut, Iowa, Mississippi, Montana, New Jersey, and Oregon), we included state-specific Secretary of State voting data. The links to those state-specific totals can be found below:
- Alabama: Comprehensive Voter Turnout 1986-2024
- Connecticut: 2024 Statement of Vote
- Iowa: REPORT OF VOTERS REGISTERED AND VOTING
- Mississippi: Certification of Vote for Electors for President and Vice President and 2024 November General Election Absentee Report (November 4)
- Montana: 2024 Montana General Election Absentee Ballot Counts and Statewide Voter Turnout
- New Jersey: Total Number of Registered Voters, Ballots Cast, Ballots Rejected, Percentage of Ballots Cast and the Total Number of Election Districts in New Jersey
- Oregon: STATISTICAL SUMMARY November 5, 2024, GENERAL ELECTION
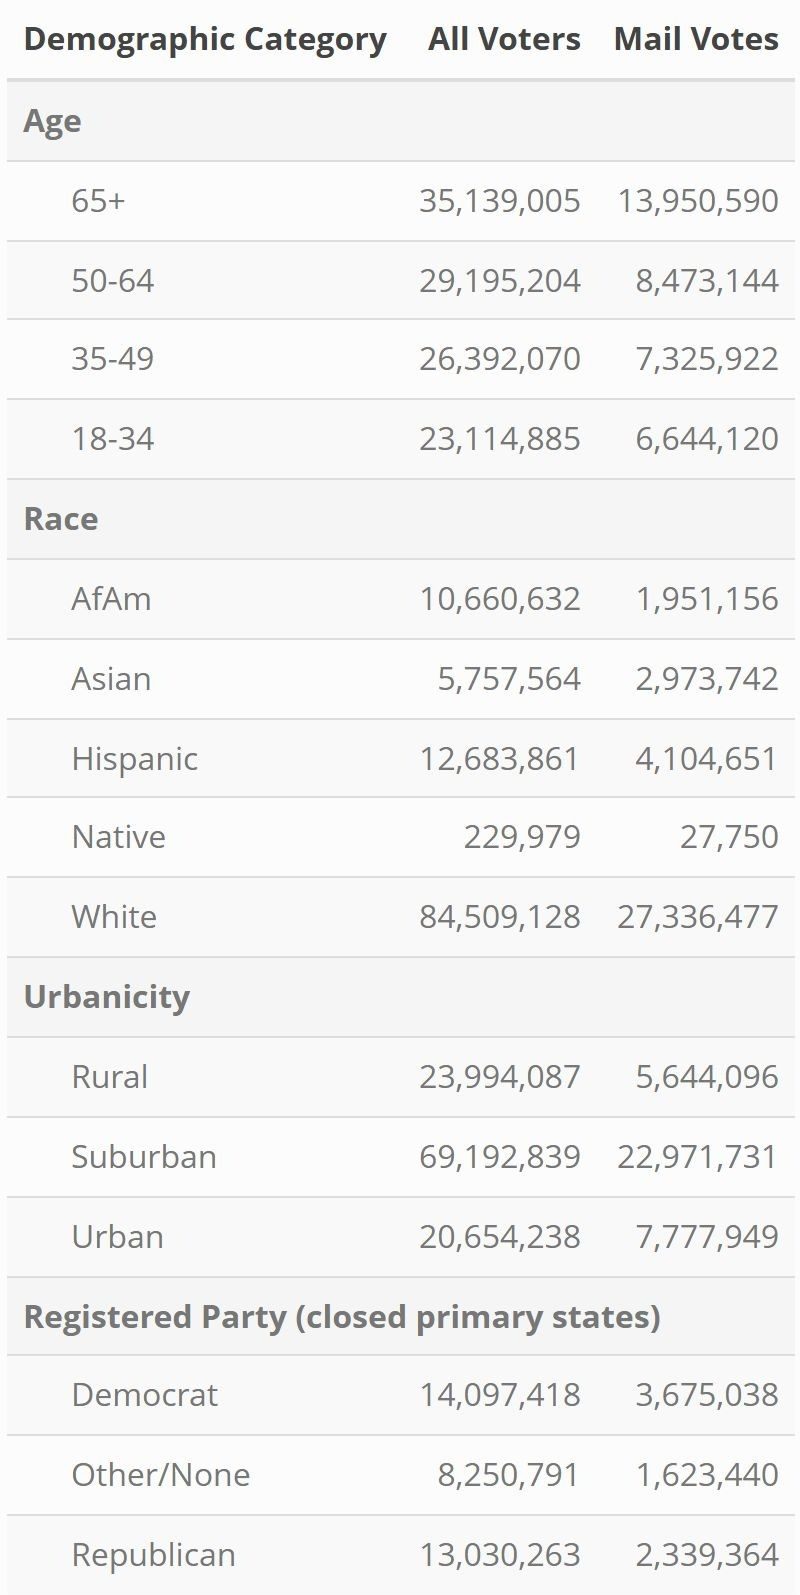
The table below provides the raw numbers on which the demographic charts are based: total numbers of those who voted from each demographic group and the numbers who voted by mail.
The following states are excluded from the demographic analysis because the TargetSmart voter file does not have any vote type data for them: AL, DE, IL, KS, KY, LA, MA, MI, MO, MS, ND, NE, OH, OR, SC, SD, UT, VT.
For the analyses using registered political party, we examined states with closed primaries that require voters to register by party to vote in primary elections. Fifteen states total have closed primaries: CT, DE, FL, KY, ME, MD, NV, NY, OK, OR, PA, SD, UT, DC, WY. Of these states, our analysis reflects ten of them, because five of these states did not have vote type data in the voter file. The five closed-primary states not reflected in this demographic analysis are: DE, KY, OR, SD, and UT. For analyses using estimated political party, the modeled variable comes from TargetSmart. For more information on their methodology see here.