Americans Oppose ICE at Polling Places
In This Resource
Americans do not want federal immigration agents at or near their polling places during midterm elections this year.
When asked in a recent survey about the idea of President Trump sending Immigration and Customs Enforcement (ICE) agents to polling places to ensure that only Americans are voting, people showed notably more opposition than support. When asked separate questions about stationing state and local law enforcement, the National Guard, or ICE at voting locations, most Americans opposed having ICE present.
The results clearly show that having federal immigration agents at the polls is unpopular with Americans.
While it is illegal for there to be armed federal agents at polling places, the president’s inner circle has pushed for it. Though some officials at the U.S. Department of Homeland Security have insisted it won’t happen, the president has not explicitly said whether he would send ICE to the polls. Several states are attempting to ensure that does not happen.
States United partnered with YouGov on a national survey of 1,570 adults from February 11 through 19, 2026, to better understand Americans’ views on this issue.
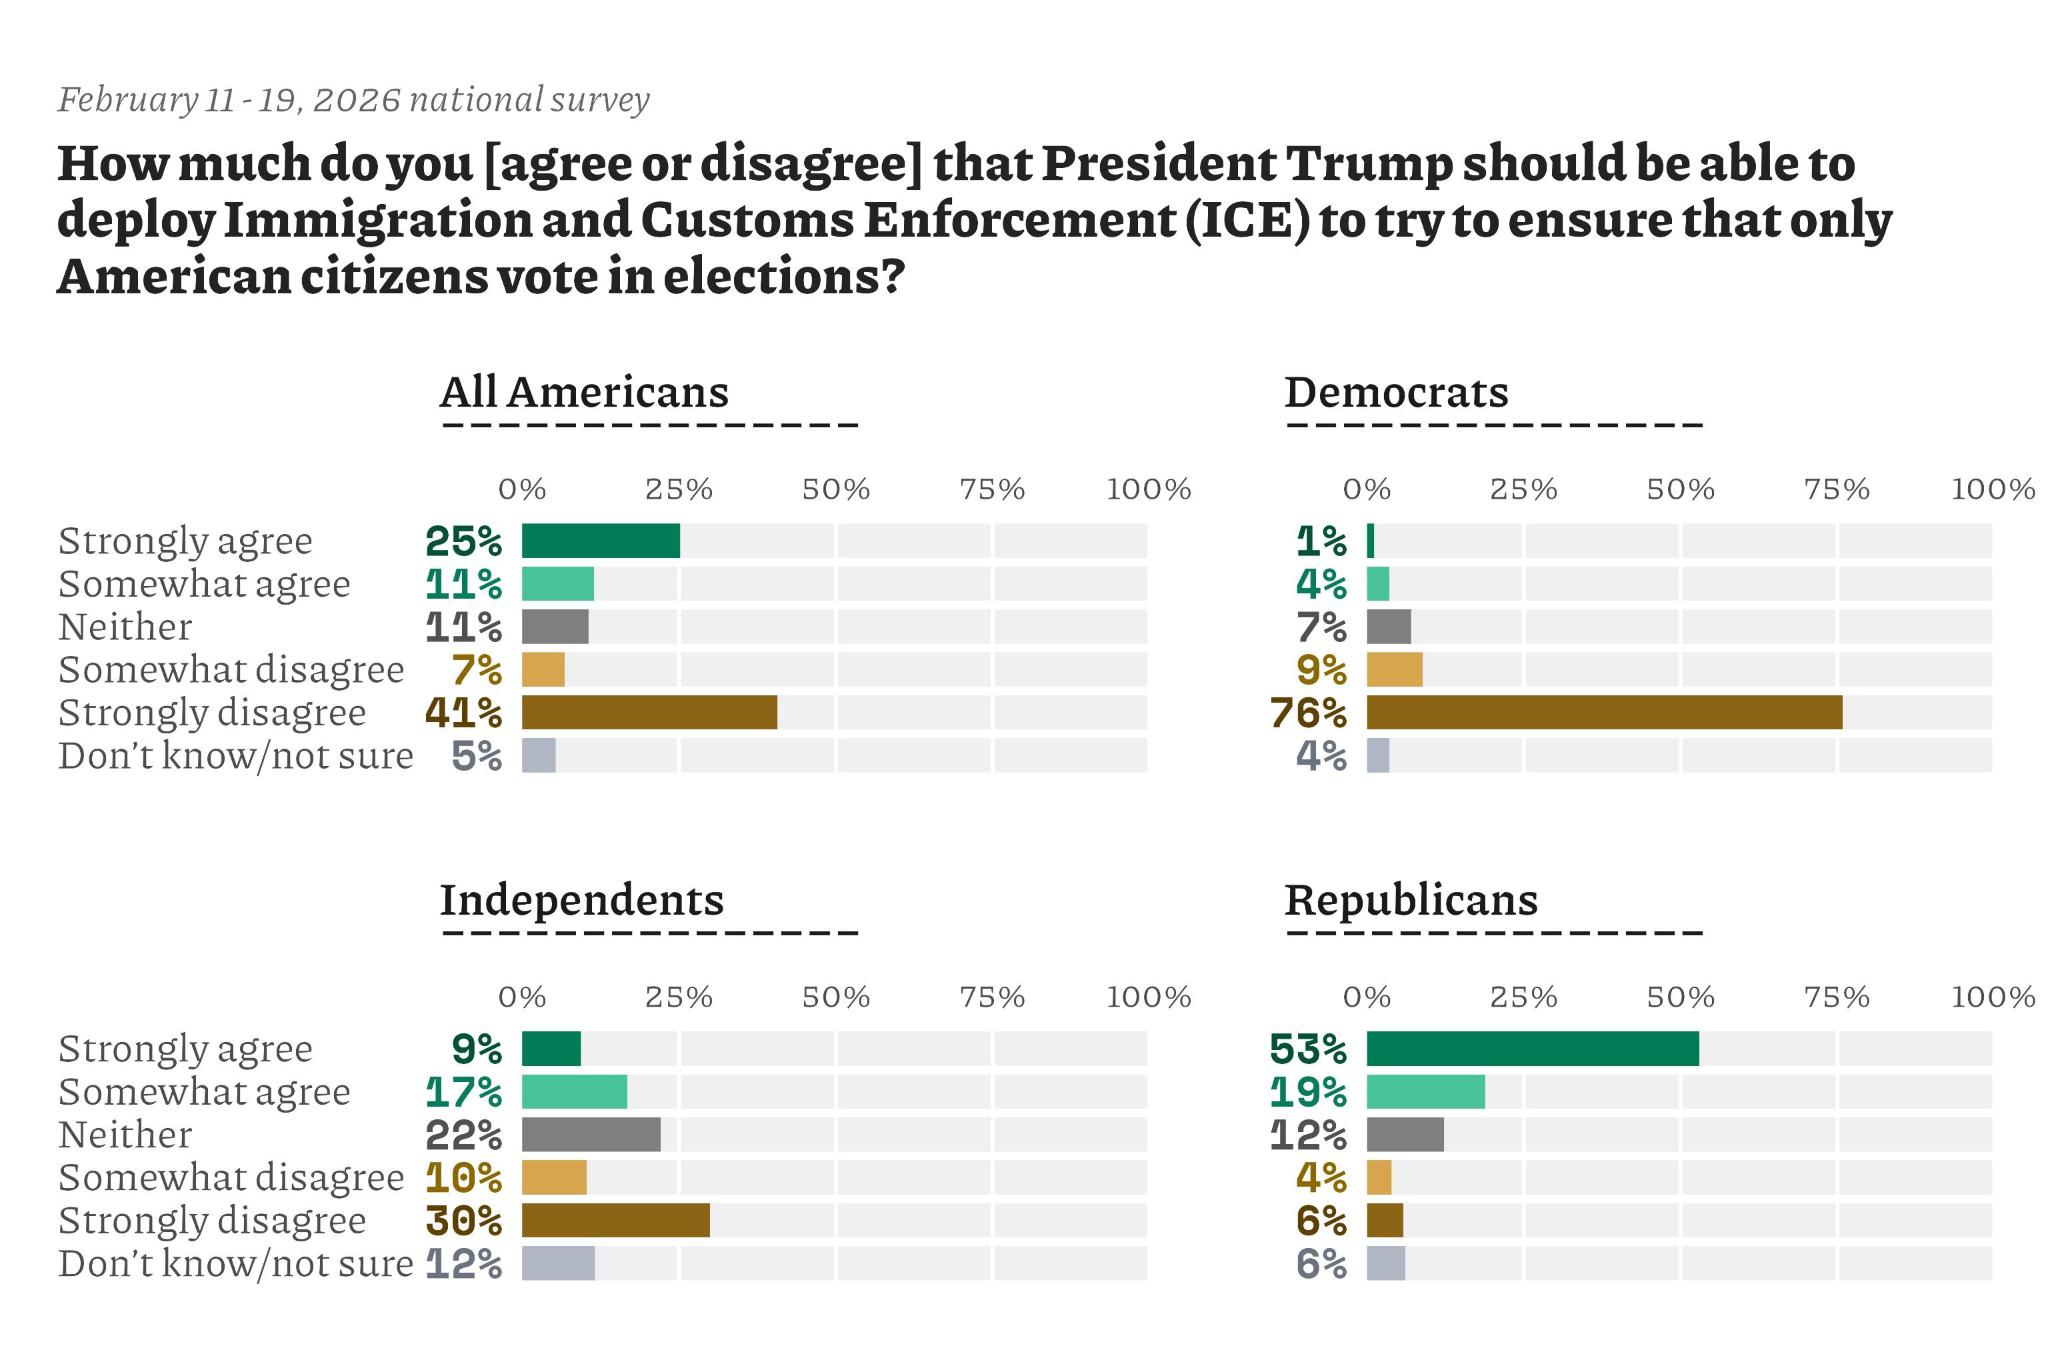
- In the first question, more Americans disagreed than agreed that the president should be able to deploy ICE to ensure only American citizens vote in elections.
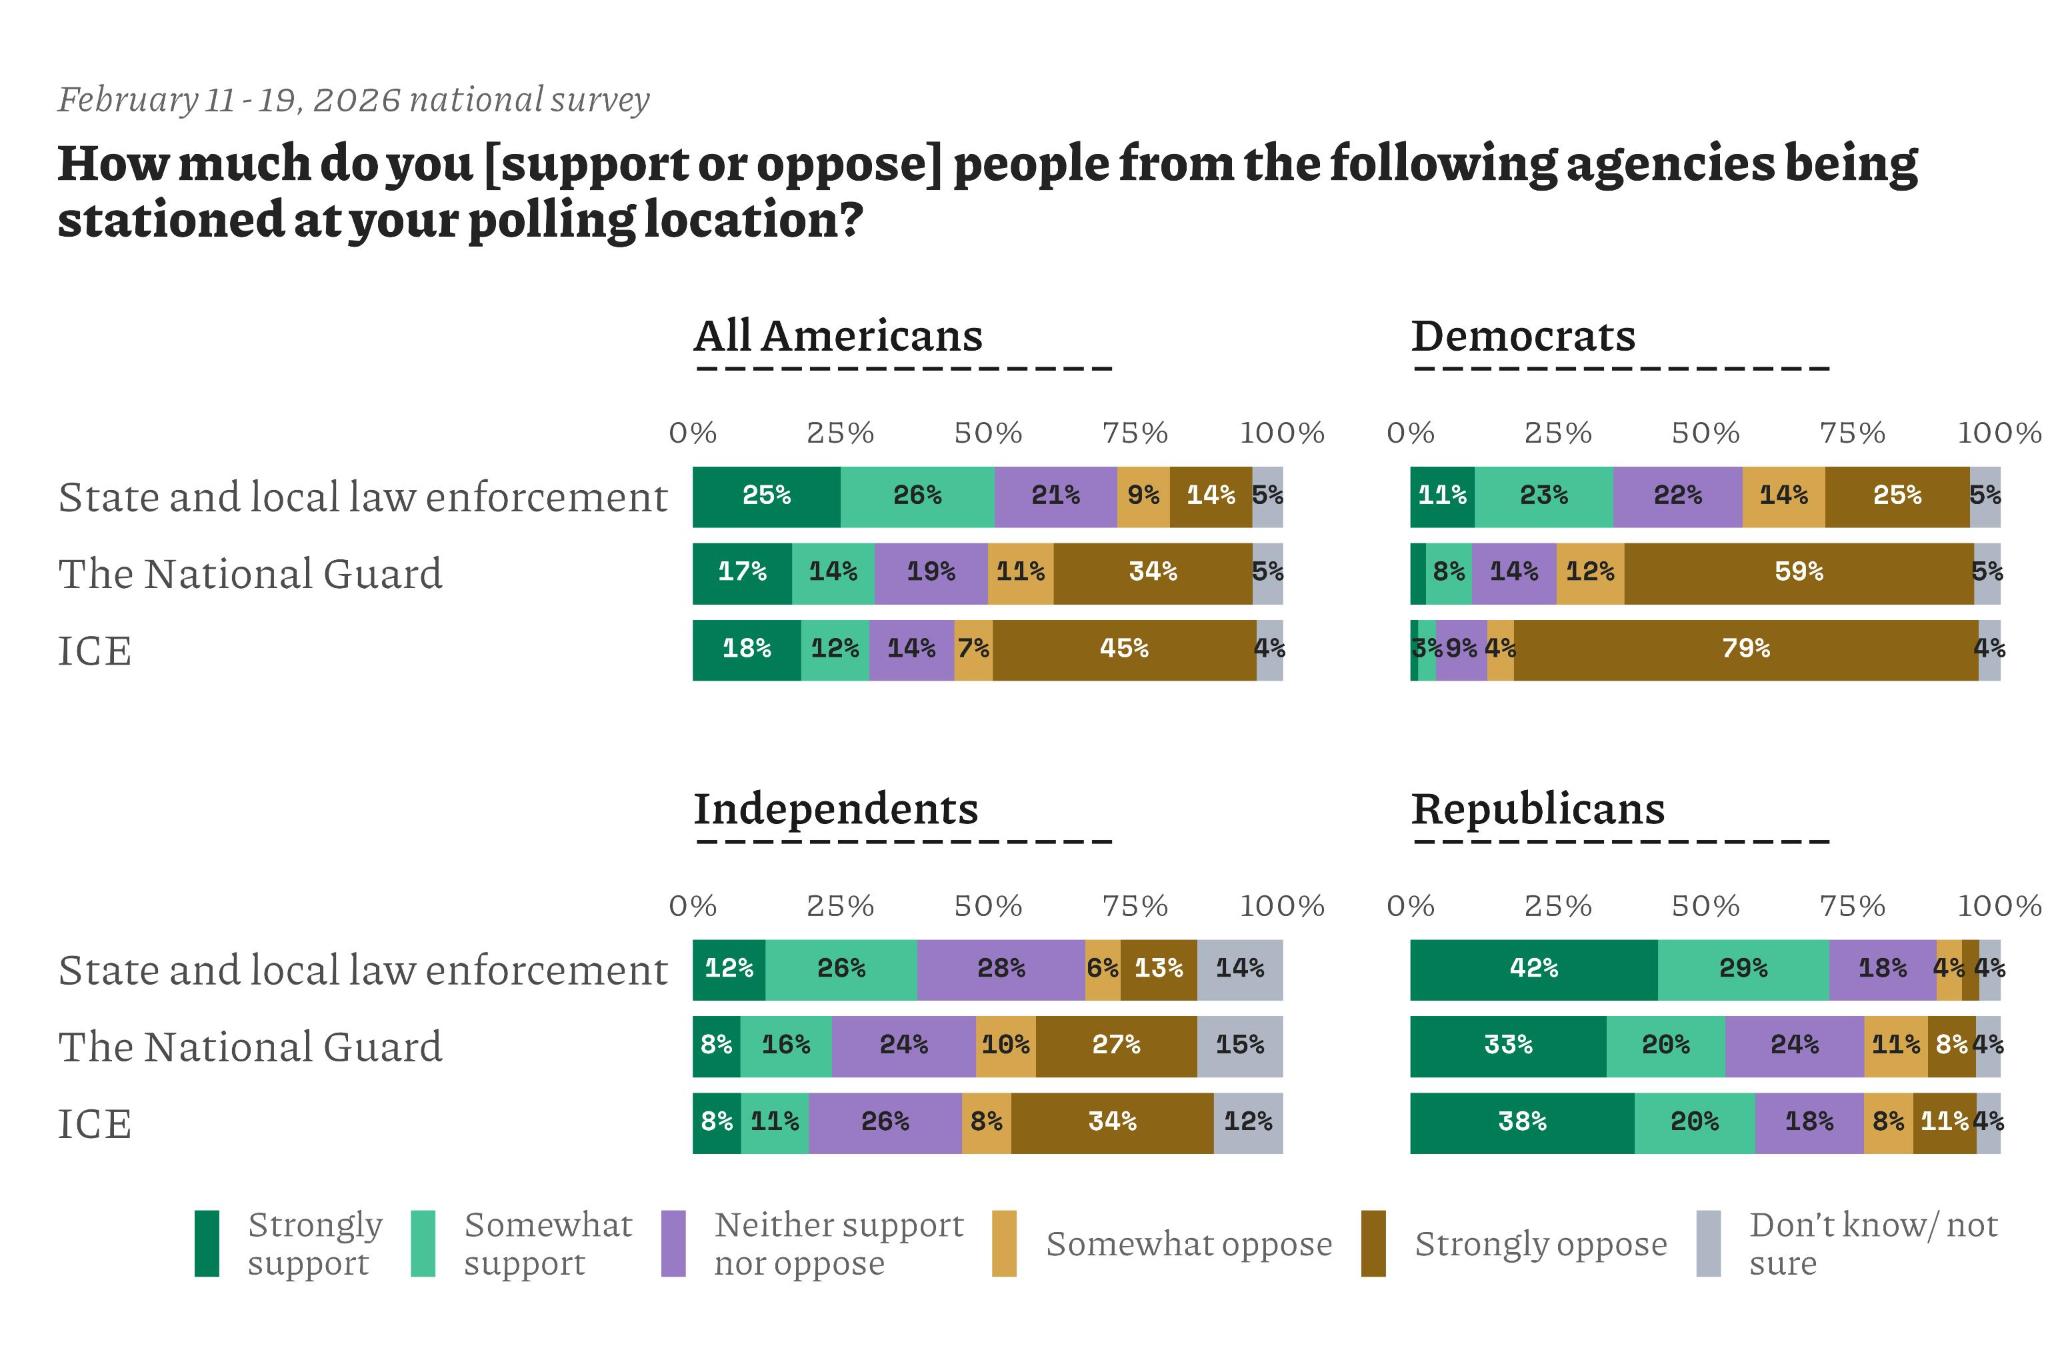
- In the second set of questions, a slim majority of Americans supports having state and local law enforcement stationed at their polling locations. But most Americans oppose ICE being stationed at their polling locations, and less than a third of Americans want the National Guard at the polls.
- Public opinion on ICE at polling places is split along party lines. In both questions, most of the support came from Republicans, though it was higher when asked if ICE should be stationed at polling locations to ensure that only citizens vote. Across the two questions, the coalition of those who disagree that ICE should be deployed to the polls is largely made up of Democrats and independents.
We asked how much Americans agreed or disagreed that President Trump should be able to deploy ICE to try to ensure that only American citizens vote in elections. Just under half (48%) said that they strongly or somewhat disagreed that he should be able to deploy ICE, compared to 36% who expressed some level of agreement that Trump should be able to do so.
Among Democrats, 85% disagree (76% strongly so) with the notion of President Trump sending ICE to the polls, compared to 72% of Republicans who agree. The plurality of independents say that they somewhat or strongly disagree (40%) and just 26% of them say that they agree.
We also asked how much Americans support or oppose people from ICE, the National Guard, and state and local law enforcement being stationed at their polling locations. While a bare majority (51%) strongly or somewhat support people from state and local law enforcement agencies being there, substantially fewer say that they support the presence of ICE personnel (30%) and members of the National Guard (31%). Most Americans (52%) oppose ICE being present.
Support differs across partisan groups: About 83% of Democrats oppose of having ICE agents at their polling locations while just 4% support doing so. Support among independents is also low (19% approve and 42% disapprove), but the policy has support among Republicans (58% approve and 19% disapprove).
These data are taken from a States United survey based on 1,570 interviews conducted on the internet of U.S. adults. Participants were drawn from YouGov’s online panel and were interviewed from February 11 to 19, 2026. Respondents were selected to be representative of American adults. Responses were additionally weighted to match population characteristics with respect to gender, age, race/ethnicity, education of registered voters, and U.S. Census region based on voter registration lists, the U.S. Census American Community Survey, and the U.S. Census Current Population Survey, as well as 2022 midterm turnout and 2020 and 2024 Presidential vote. The margin of error for this survey is approximately ± 2.7 percentage points, though it is larger for the analysis of partisan subgroups described above. Therefore, sample estimates should differ from their expected value by less than the margin of error in 95% of all samples. This figure does not reflect non-sampling errors, including potential selection bias in panel participation or measurement error.
In keeping with best research practices, we classify independent voters who reported “leaning” toward either the Democratic or Republican parties as partisans. Therefore, we define “independents” as those respondents who professed no partisan attachments whatsoever.