Tracking Attitudes About Elections and Political Violence Over Time
In This Resource
- Executive Summary
-
A Methodological Note
- Confidence in American Elections
-
The Importance of Counting Every Vote
- Belief That the 2020 Election Was Rigged
- Support for Election-Denying Candidates
-
Views of Election Fraud
- Concern About False and Misleading Information
-
Views of Political Violence
-
Trust in Methods of Voting
-
Trust in Methods of Casting Votes
-
Trust in Methods of Counting Votes
- Methodology
Updated August 16, 2024
At a challenging time for American democracy, it’s more important than ever to understand how Americans feel about elections, voting, and political violence. The States United Democracy Center conducted five surveys over the past year, from June 2023 to June 2024, to gauge these attitudes.
The findings were encouraging: even at a time of polarization and rampant lies about elections, the survey responses paint a picture of stable, widely shared pro-democracy sentiment in the public.
A plurality of Americans are confident in the institutions of elections, and Americans express high levels of trust in the ways votes are cast and counted. They’re also concerned about political violence, and they look unfavorably on candidates who claim that the 2020 election was rigged.
Some results do show some slight changes over time, but the broader pattern consistently shows a solid foundation of support for the traditions, norms, and institutions of democracy. As the 2024 election season ramps up, these findings show that Americans believe in their elections and want to keep them free, fair, safe, and secure.
The States United Democracy Center conducted five surveys, from June of 2023 to June of 2024, to ask Americans a variety of questions related to U.S. elections. The findings offer a baseline for attitudes about election topics as the 2024 election year begins in earnest.
Major Findings
- Americans are worried about the overall quality of American democracy today, but they still hold pro-democracy views.
- Election denial is not an effective campaign strategy.
- Americans have high levels of trust in a variety of methods for voting and for counting votes.
- Americans express some concerns about disinformation and some people lack confidence in elections, but this is likely driven at least in part by rhetoric from elites.
- Views on election security, election denial, political violence, and related matters have generally been stable over the past year.
- The coalition of people opposed to political violence is broad and crosses party lines. The widespread opposition to the use of political violence suggests that there is an opportunity to counter violent threats, harassment, and rhetoric.
Readers will sometimes see movement in how people respond to our questions over time. Such movement can be interesting, but we urge caution. Much of the wave-to-wave movement is within the margins of error, which means that we can’t be certain that shifts in observed opinion are real. This is particularly true when considering opinion among independents because the number who participate in each wave of the survey is small.
These findings demonstrate a resilient base of trust in the integrity of elections, even after a yearslong campaign to erode that trust. In the most recent wave of our surveys (June 2024), a plurality of participants (47%) reported feeling completely or fairly confident that American elections are free, fair, and secure. Only 36% said that they felt slightly or not at all confident.

These trends in confidence in American elections have remained stable over the past year across all confidence levels.

In June 2024, a plurality of Americans—about 47%—reported being completely or fairly confident that American elections are free, fair, and secure. This level of confidence is consistent with the results from June 2023, indicating no meaningful change over time.

Confidence in Elections by Partisanship
When examining confidence levels across different partisan groups, we observe similar stability. Despite the highly polarized political environment, confidence in elections has not systematically fluctuated within any partisan group, though it’s important to note that the percentage of Democrats who report that they are completely confident that elections are free, fair, and secure has increased by about seven percentage points since June 2023 to 41%.

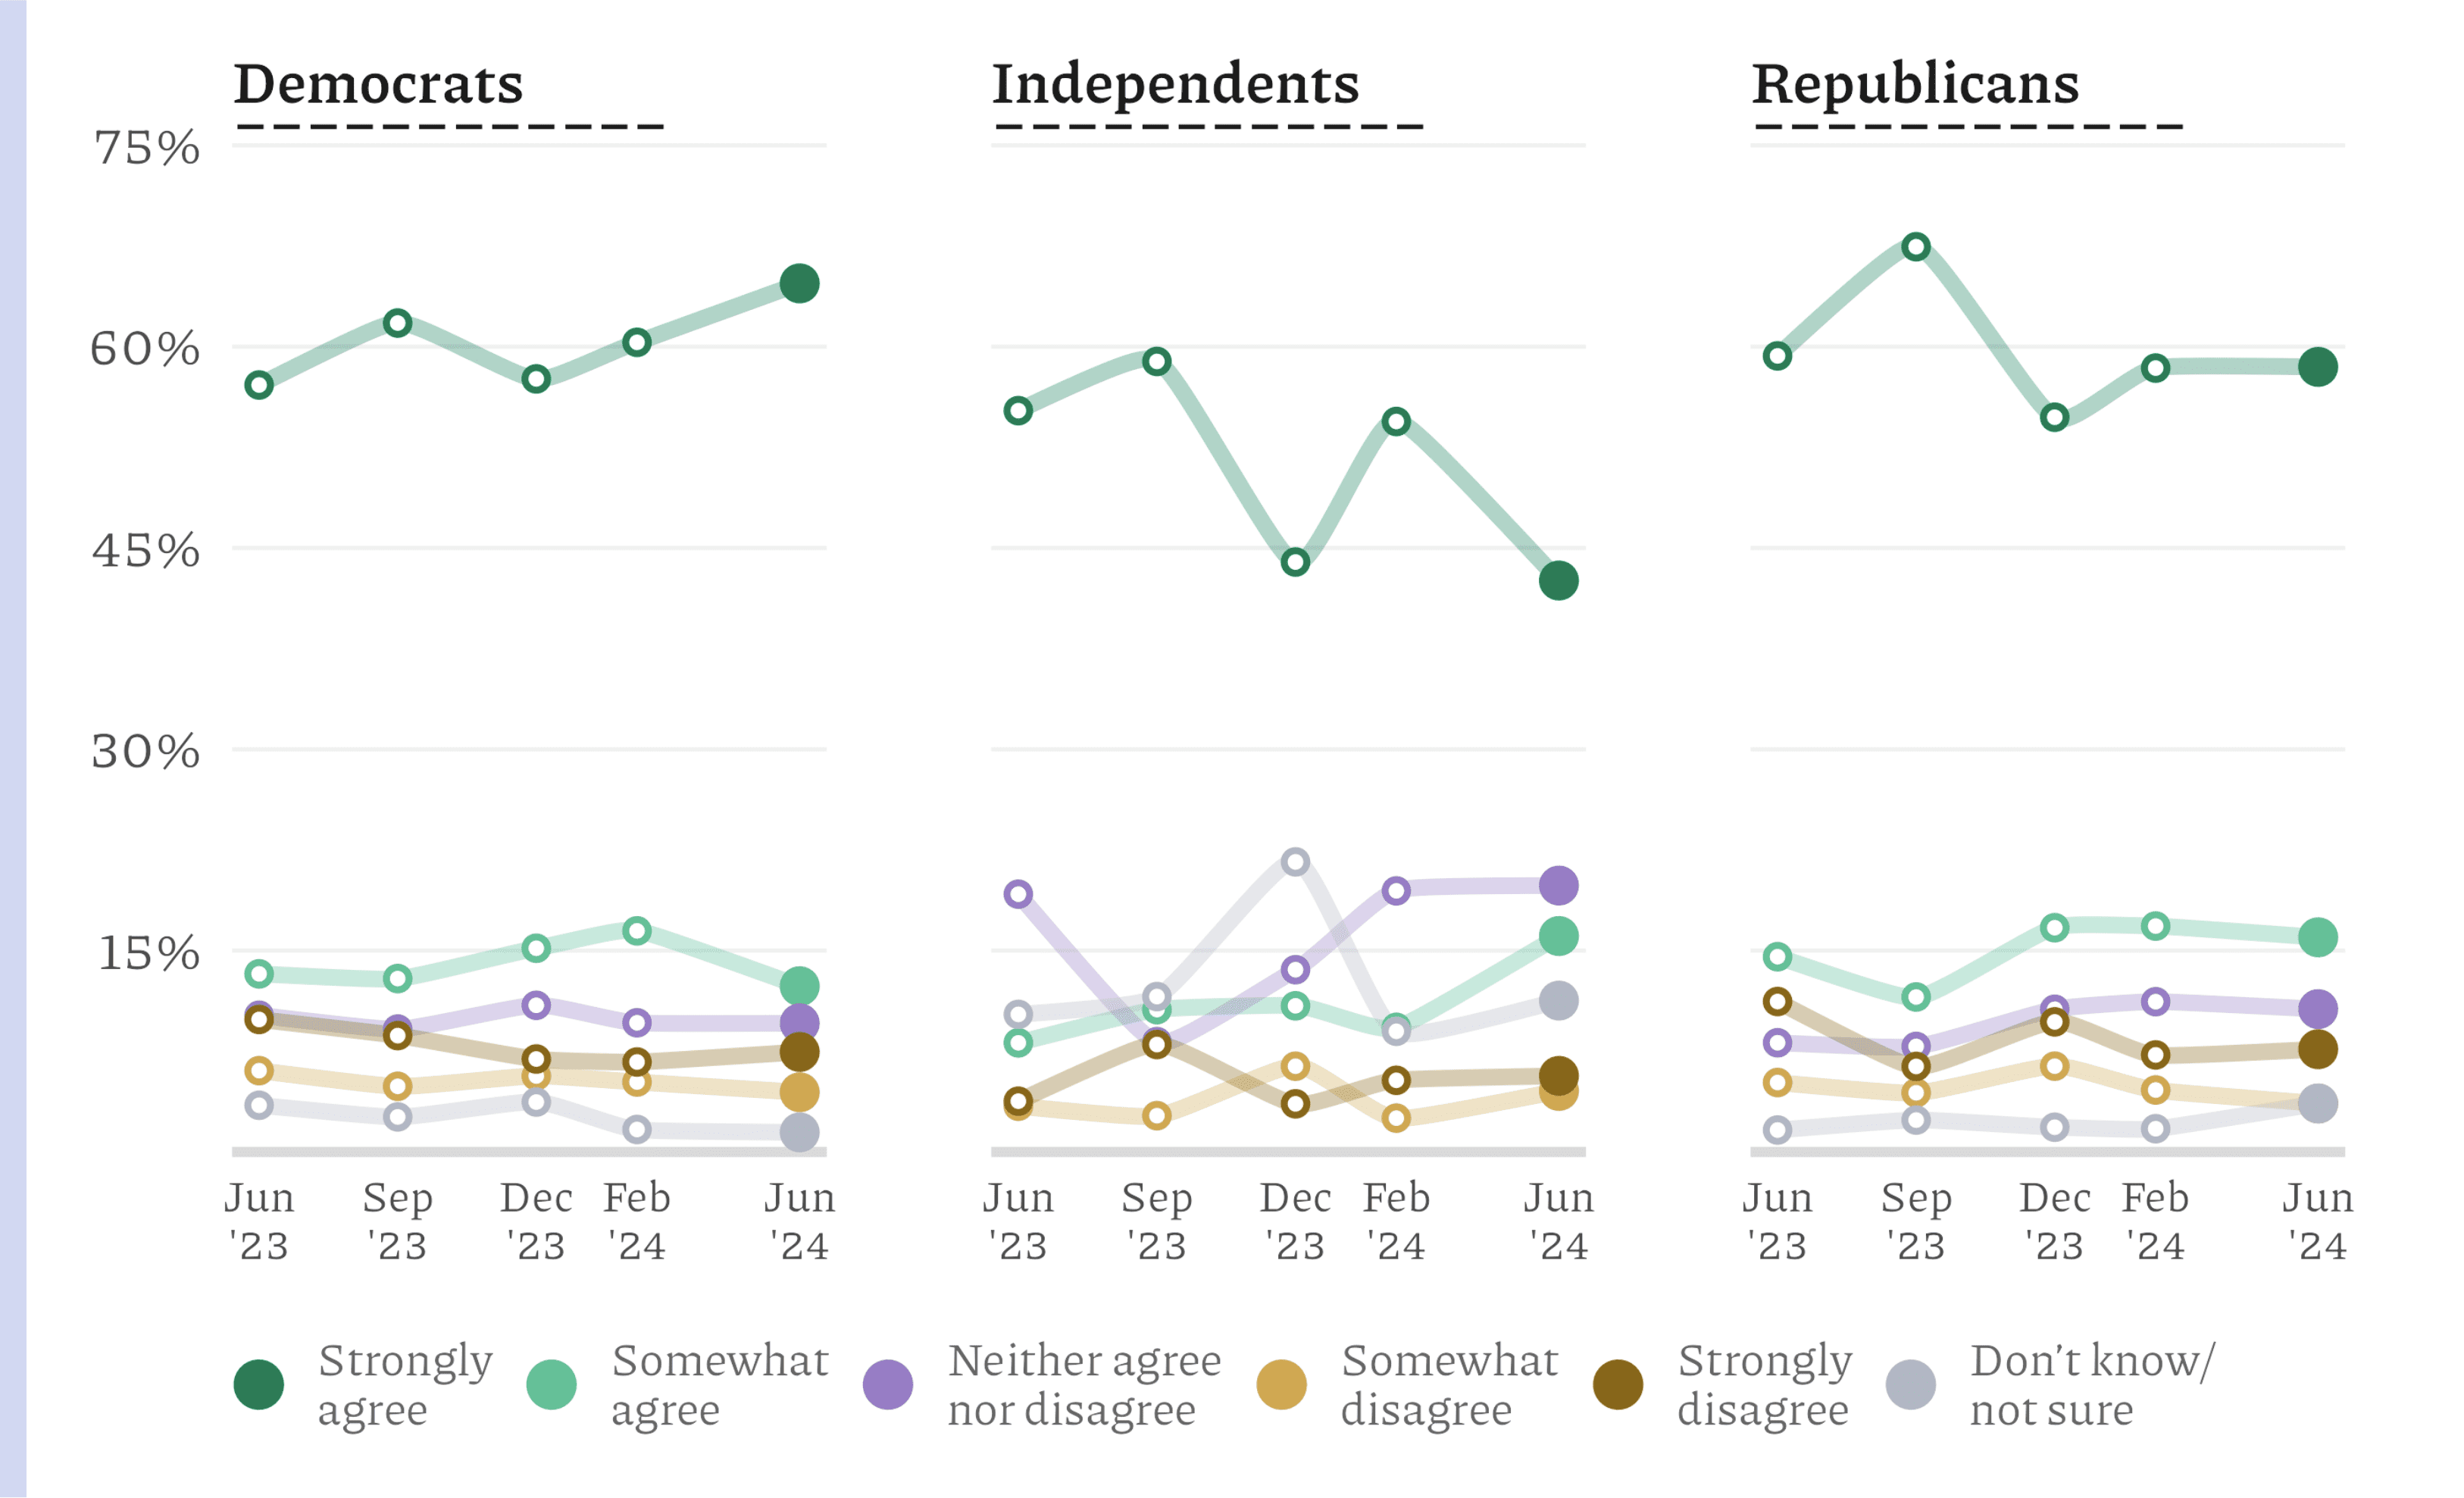
It’s a foundational principle of American democracy: we determine winners by counting votes. And counting every legal vote is more important than ensuring that our preferred candidates win. An overwhelming majority of Americans prioritize this principle. As shown below, in the June 2024 survey, 73% of respondents either strongly (59%) or somewhat agree (14%) with it.

This finding holds regardless of partisan identification and is stable over time, underscoring the enduring value placed by the American public on fair and accurate vote-counting.

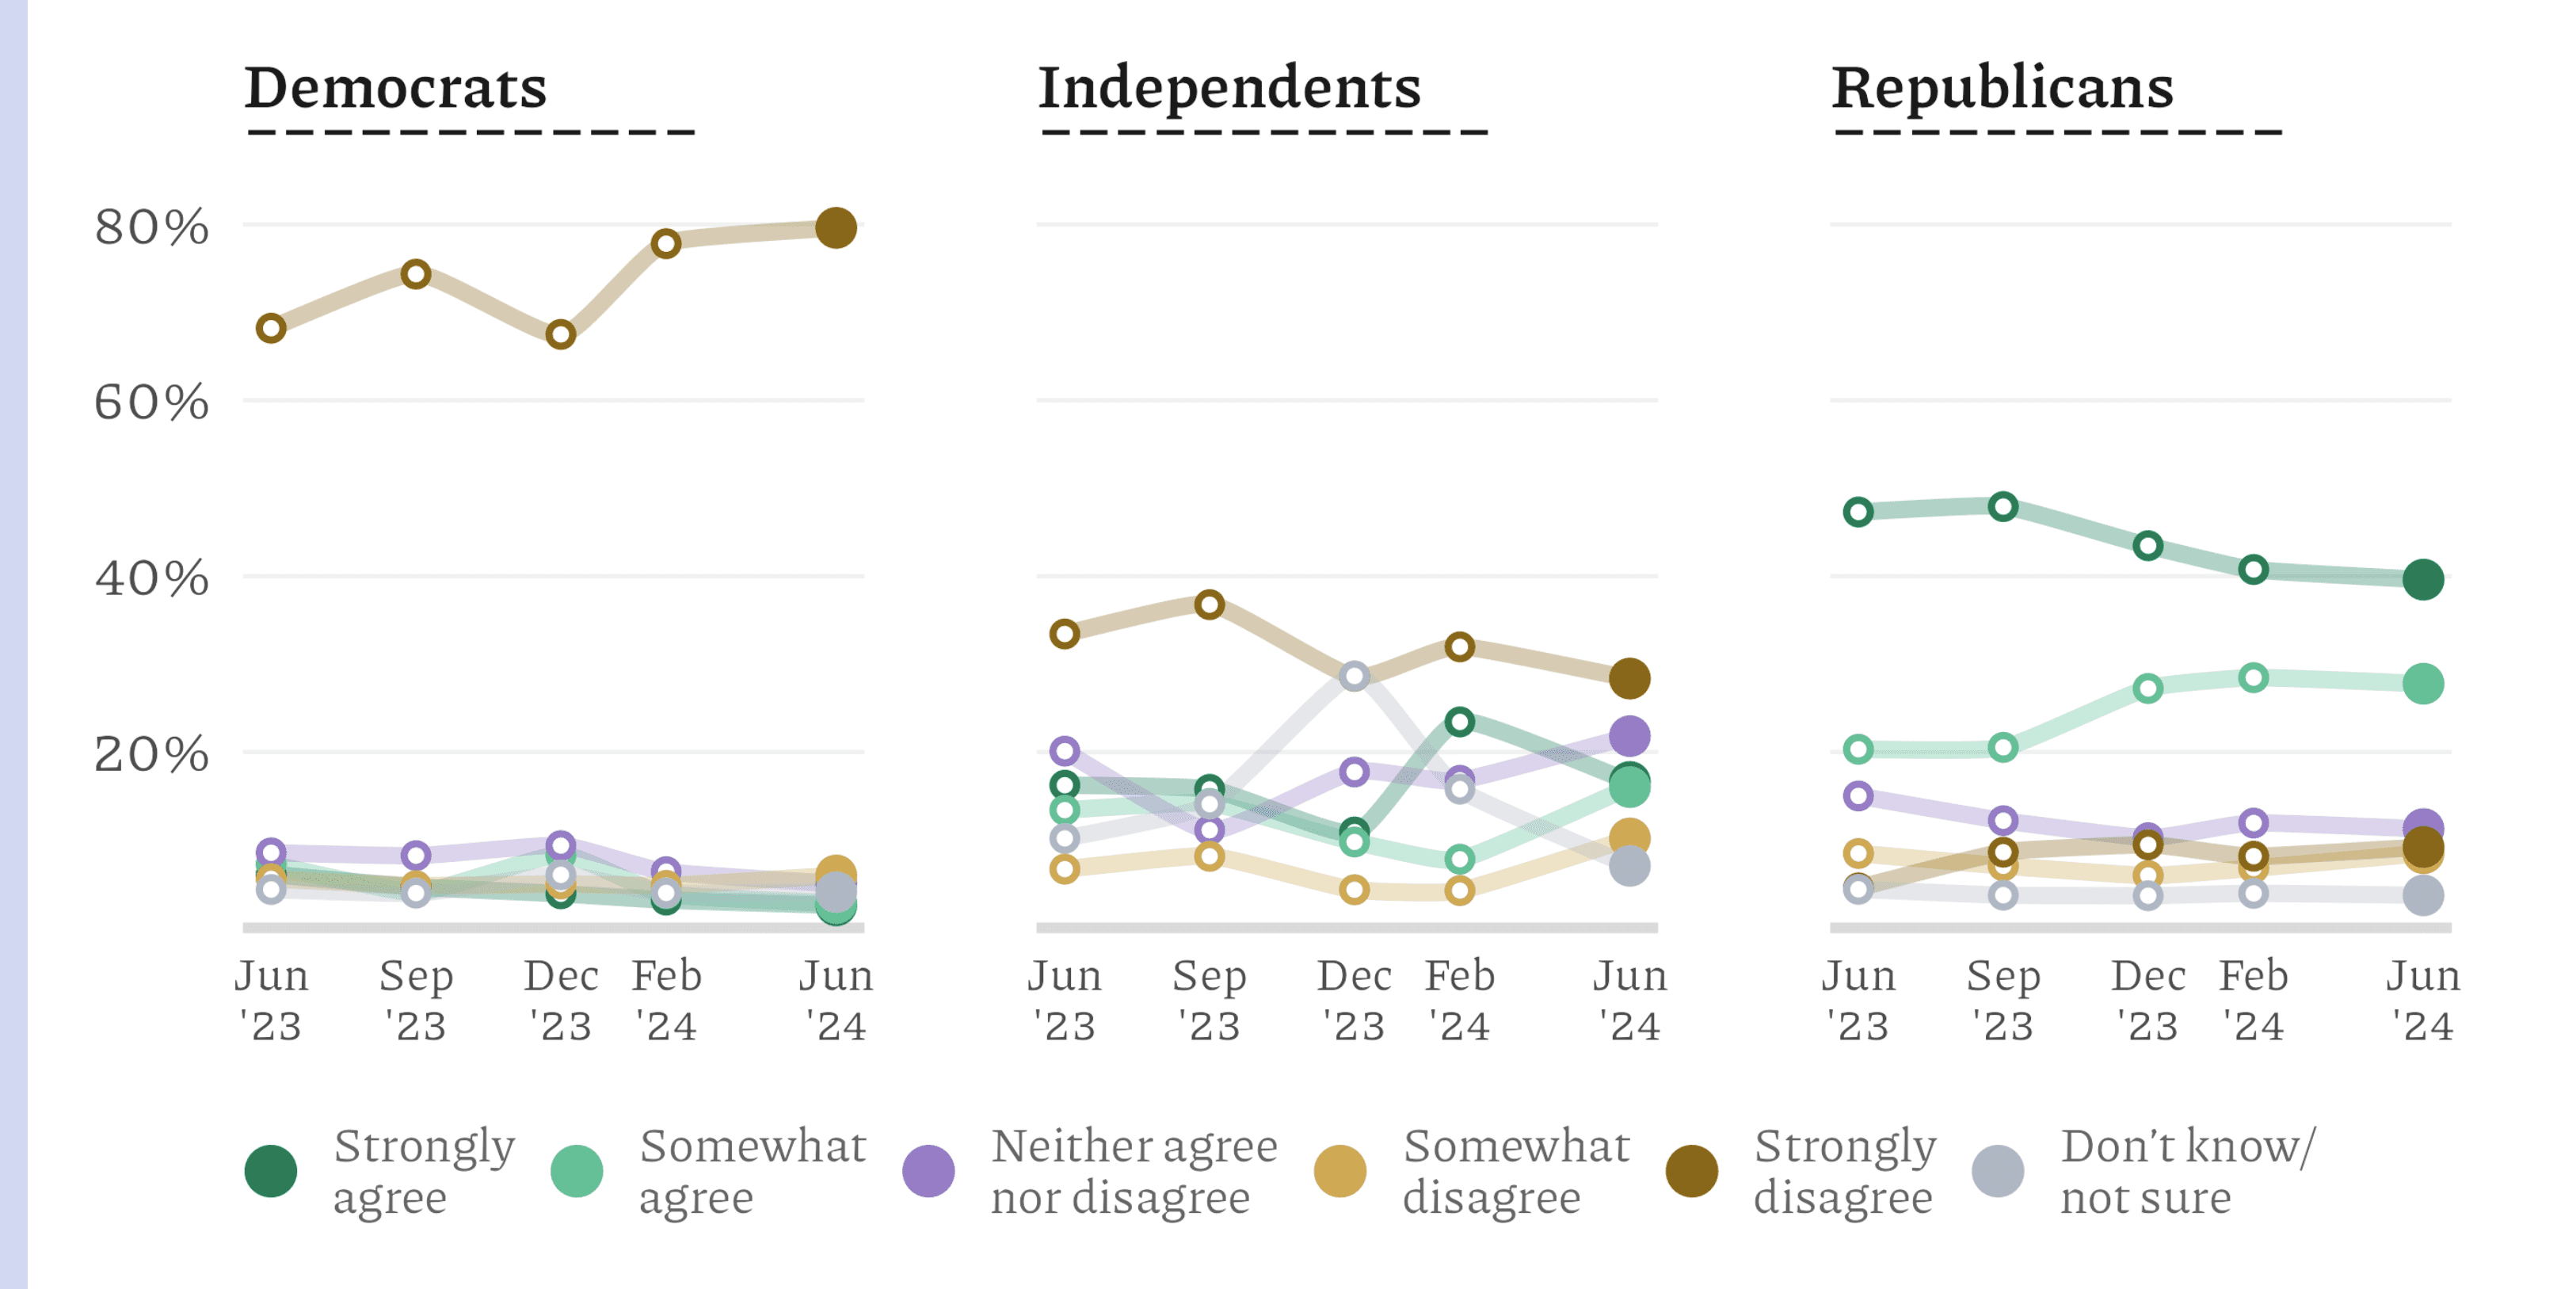
Election denial is a substantial force in American politics, but a plurality of Americans forcefully reject its central premise. A significant portion of survey respondents (44%) strongly disagree with the claim that the 2020 election was rigged against Donald Trump, as shown by the June 2024 data below.

This sentiment that has remained stable over time across all Americans.

How Partisanship Informs Beliefs That the 2020 Election Was Rigged
Democrats are much more likely to disagree that the election was rigged against Trump than independents and Republicans, and disagreement has grown over the past year. Independents are also more likely to disagree relative to Republicans. In an encouraging sign, fewer Republicans strongly endorse this false notion than did one year ago. The share of Republicans who strongly agreed that the 2020 election was rigged declined from 47% to 40% over the span of our surveys. Strong disagreement among Democrats has increased from 68% to about 80%.
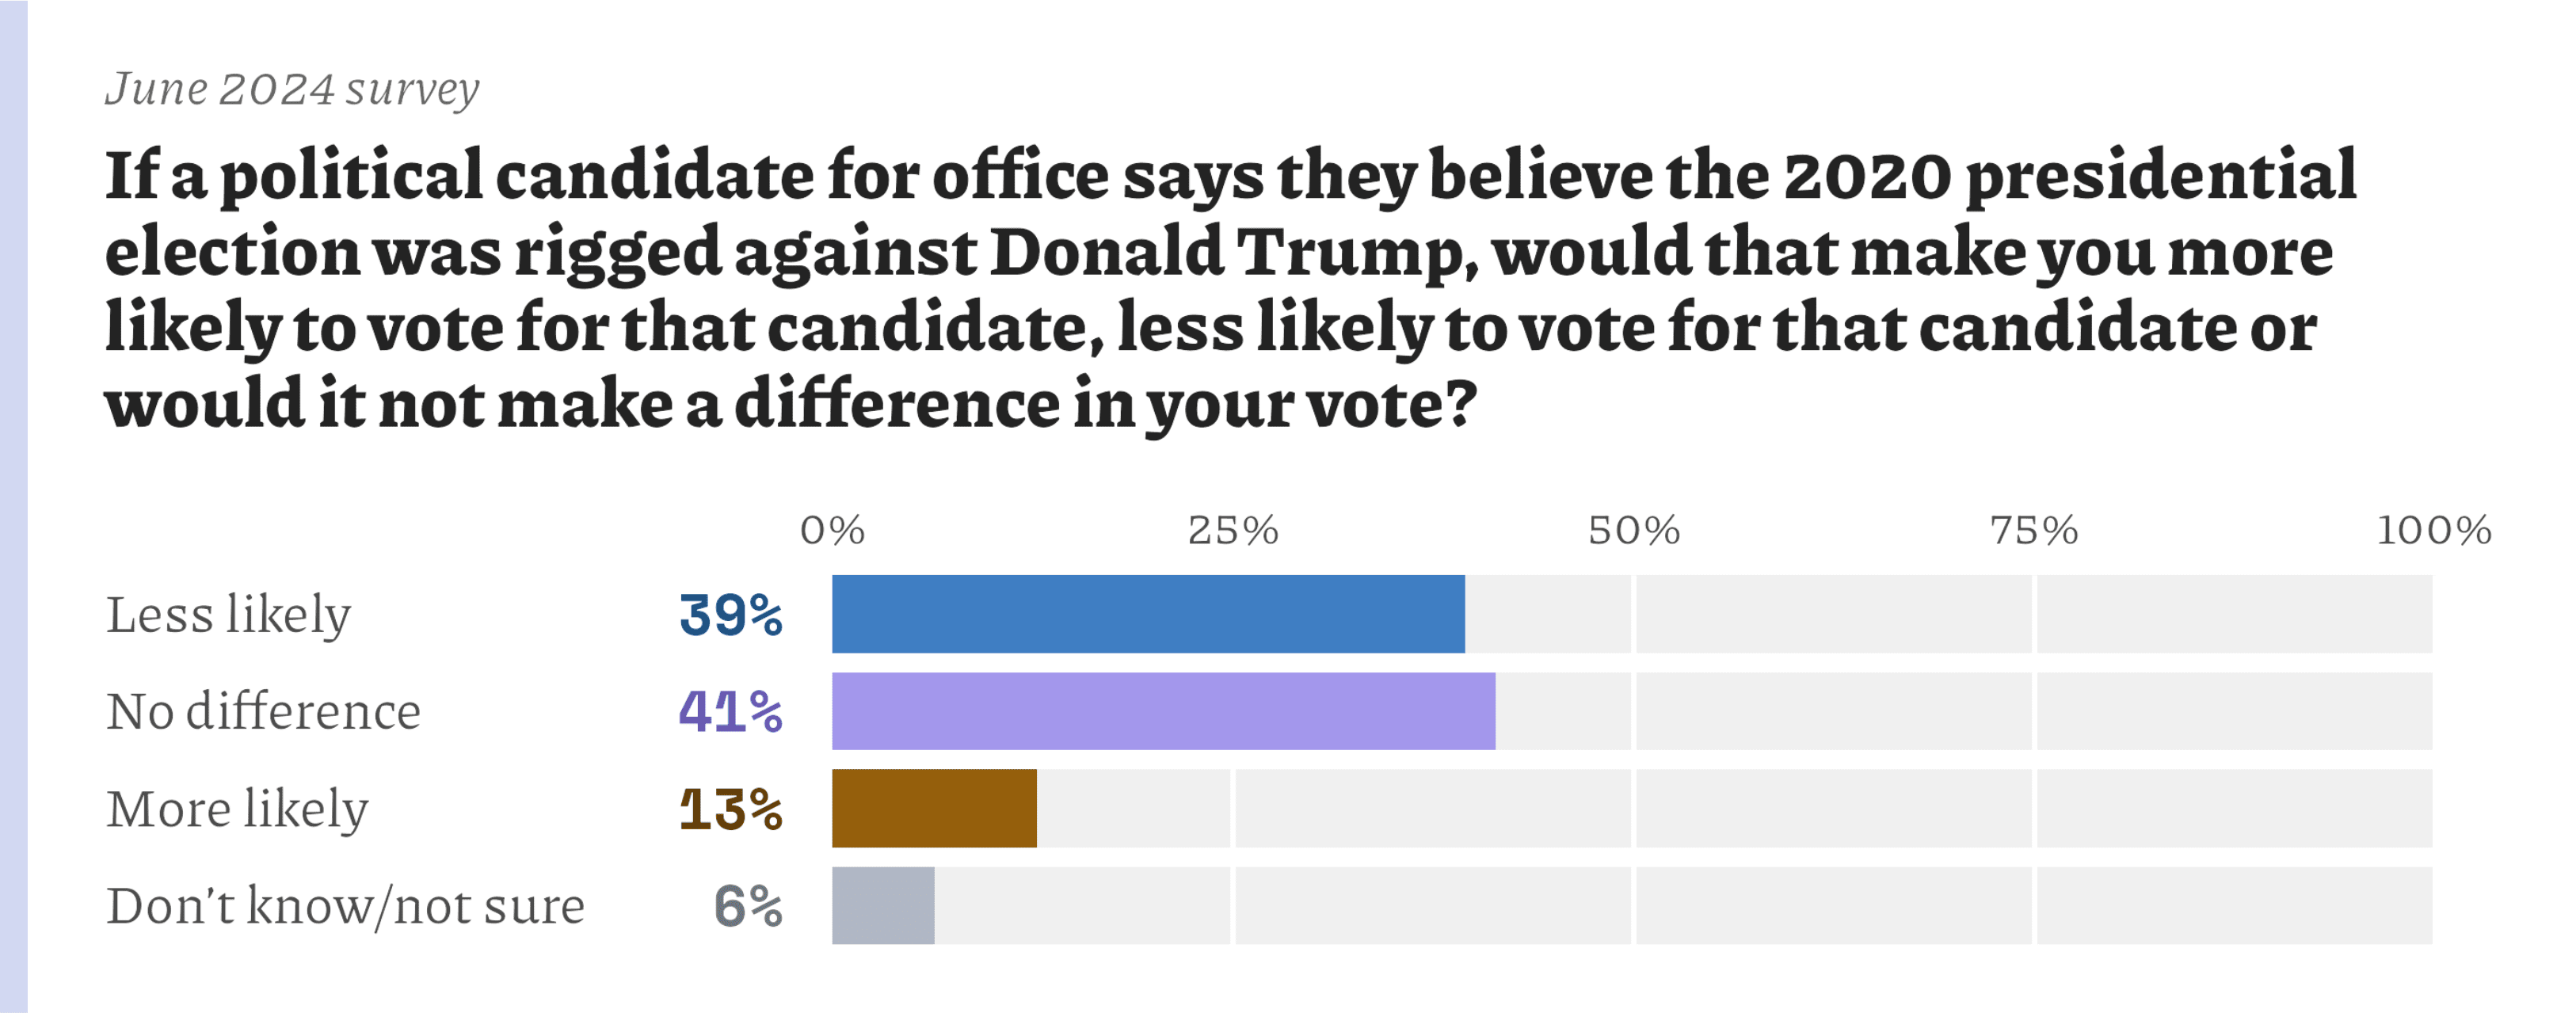
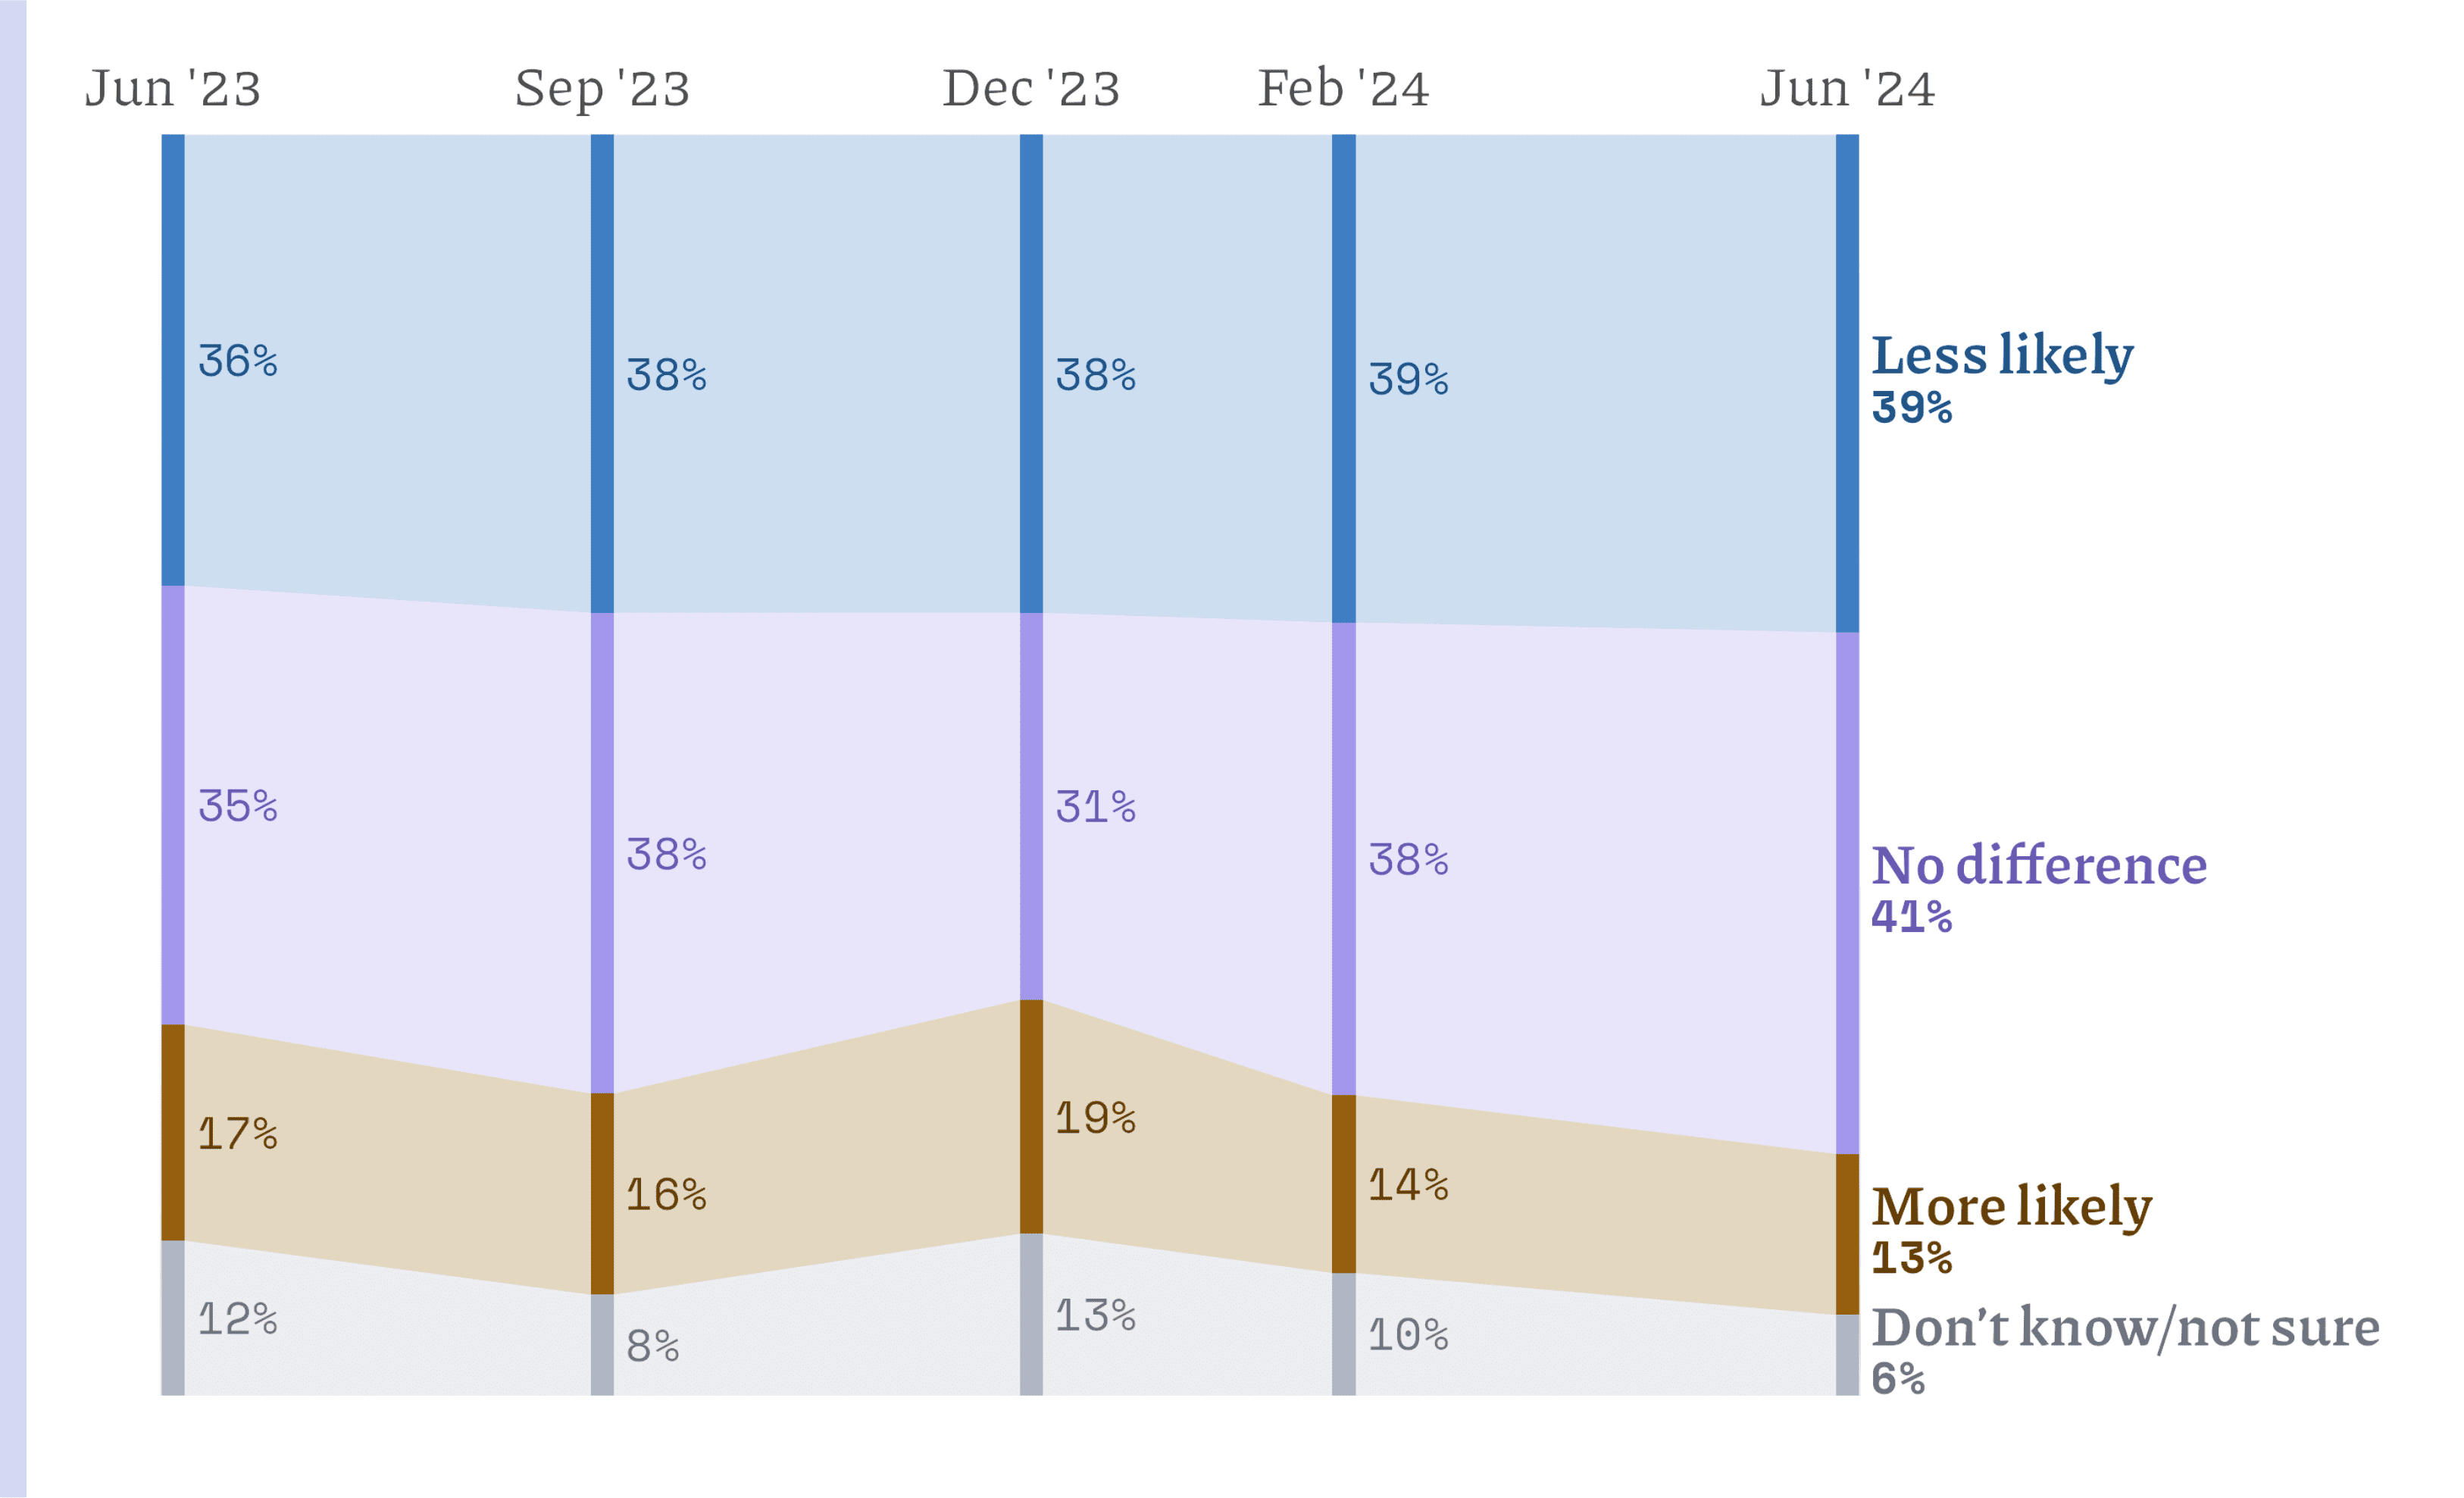
As the midterm election results in key states demonstrated, election denial is not a winner as a mainstream political strategy. The survey findings over the past year continue to bear this out. Many Americans say that election denial would make them less likely to support a candidate, and this finding is stable over time. In June 2024, for example, 39% said they would be less likely to support such a candidate, far more than the 14% who said they would be more likely to support such a candidate. The plurality (41%) say that election denial would make no difference in their choice.
This pattern has remained relatively stable over time. Since June 2023, the percentage of respondents who said they would be less likely to support a candidate who denies election results has remained consistent. The percentage of those who said they would be more likely to support such a candidate has declined slightly since December 2023, from 19% to 13%.
Partisanship and Election Denial
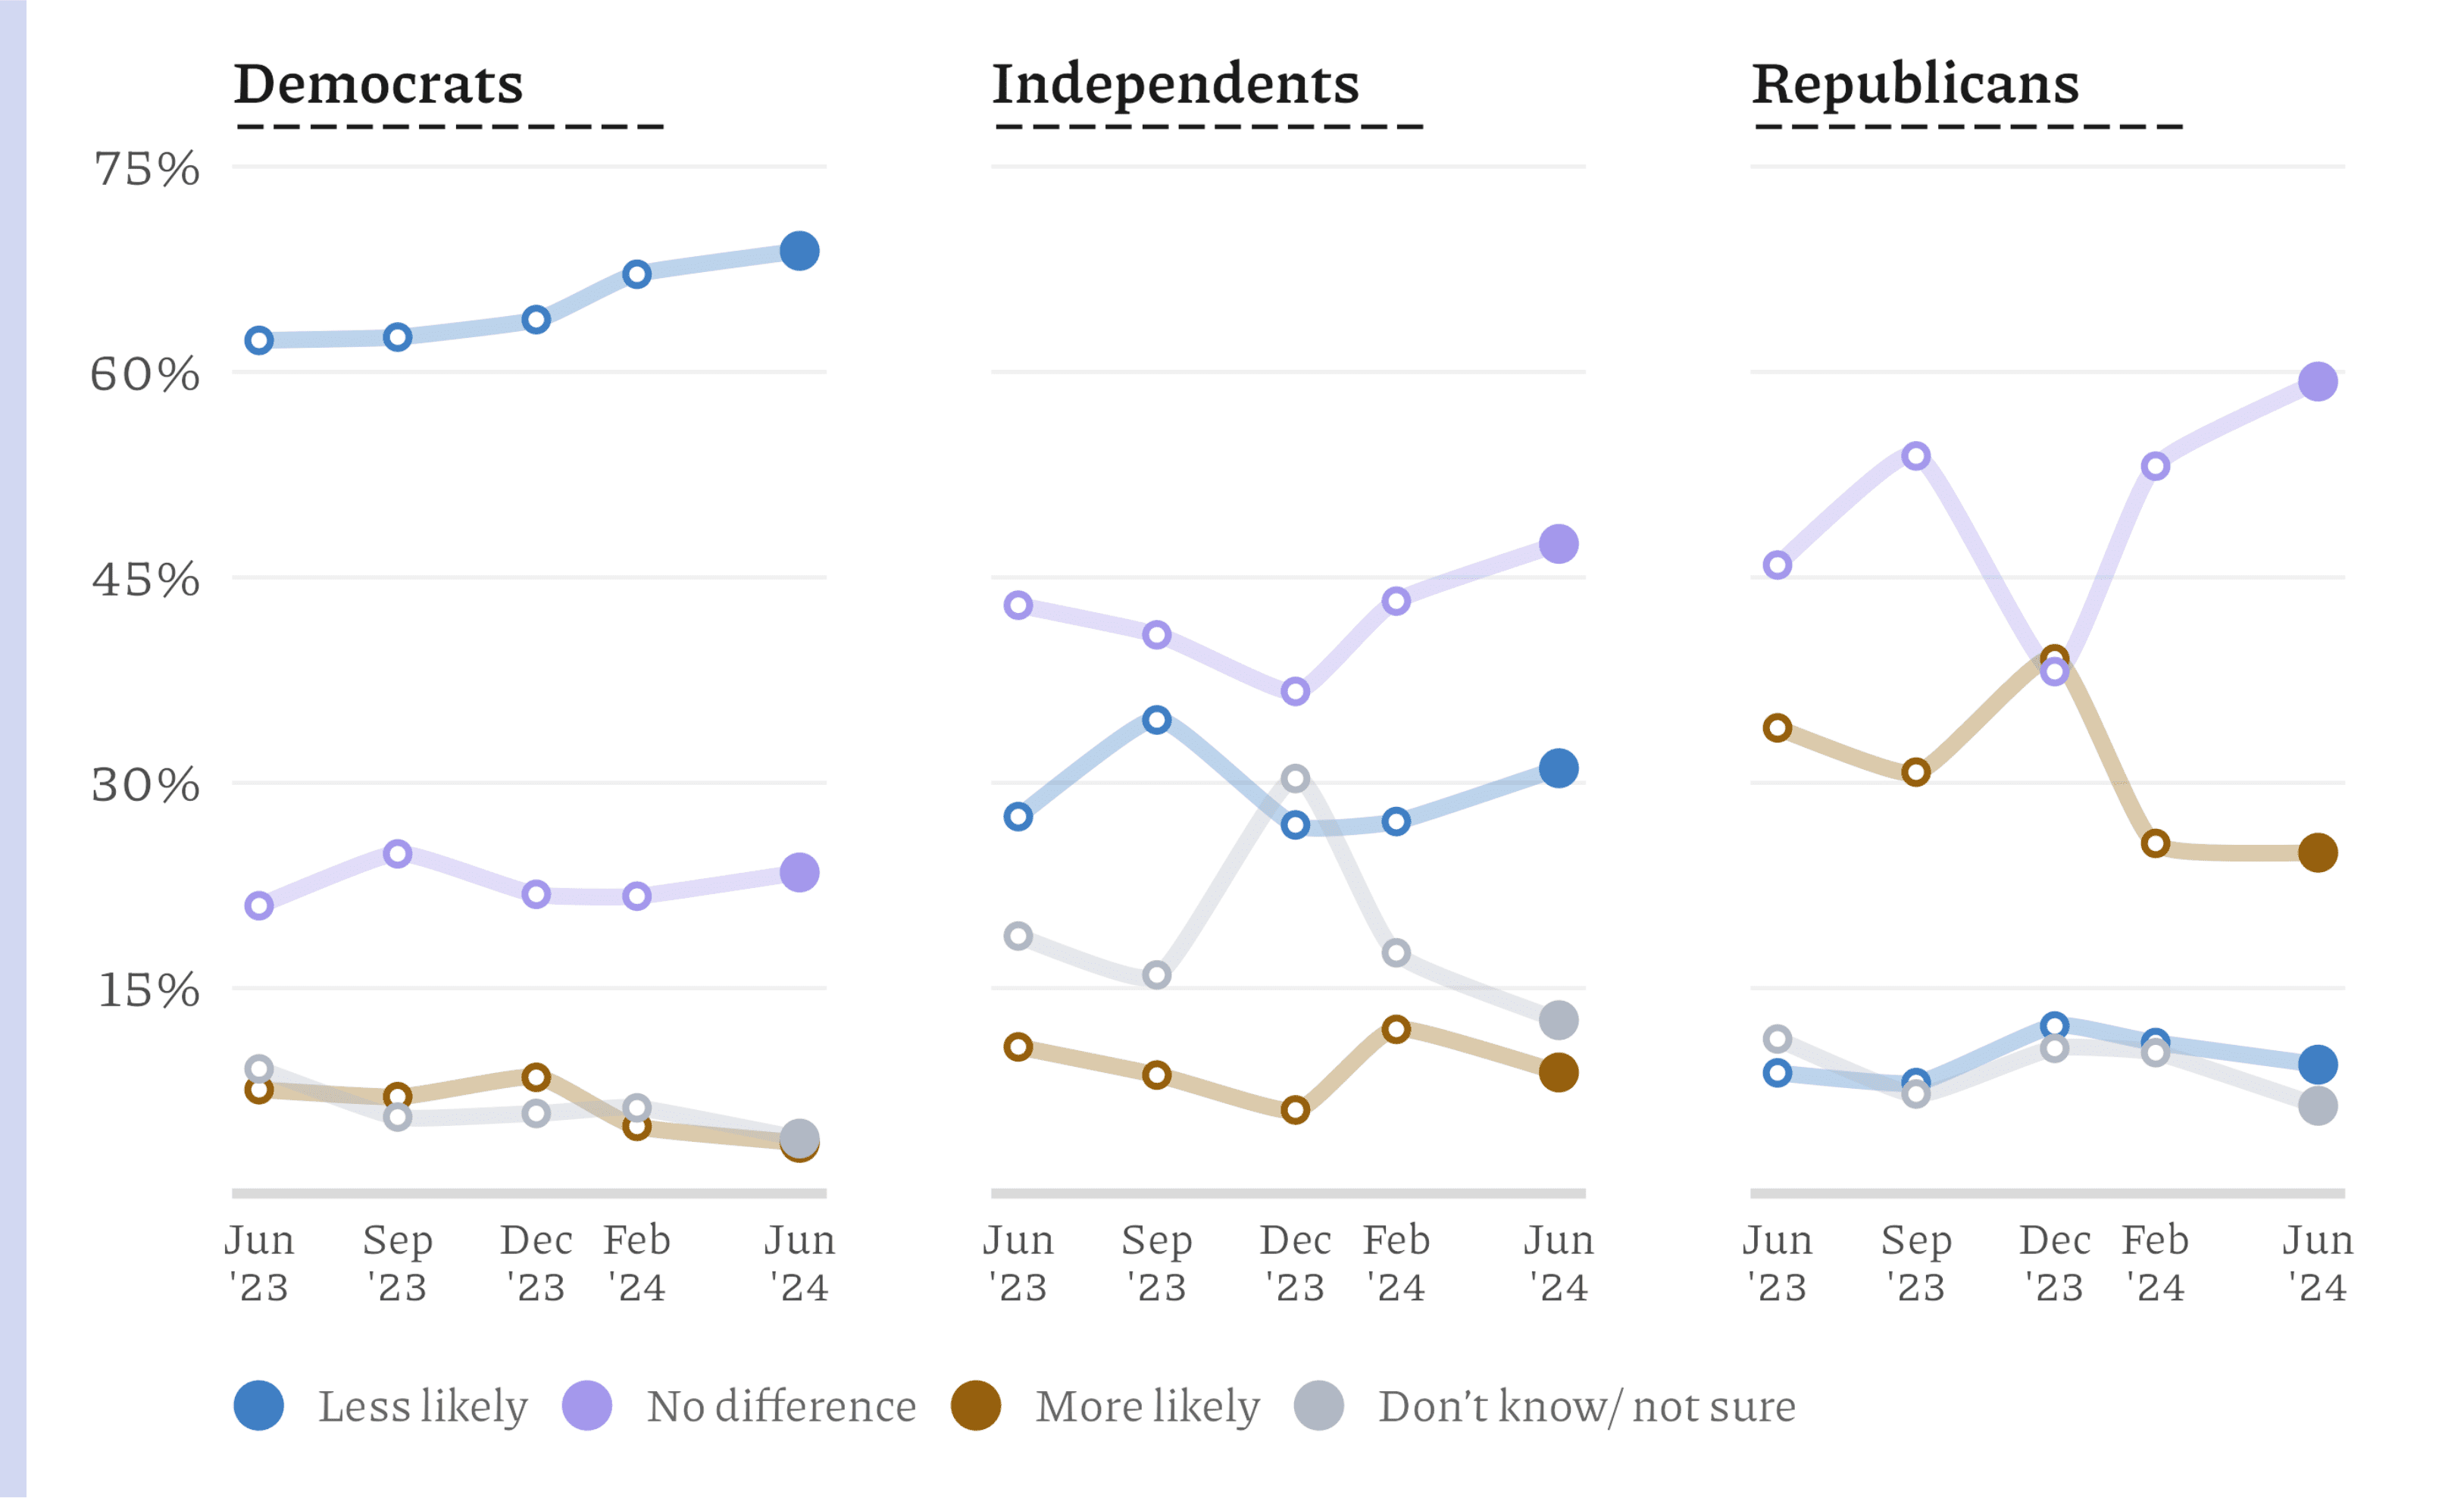
Partisans’ responses to this question also appear to be relatively stable, with majorities of Democrats saying that they would be less likely to support an election-denying candidate while pluralities of independents and Republicans say that denial makes no difference in their choices.
Three notable shifts appear to have occurred over the past year, however. First, “less likely” responses by Democrats have gradually increased from 62% to 69% from the first to the latest wave of our survey. Second, while 46% of Republicans in June 2023 said that election denial made no difference in their vote choice, by June 2024, this percentage grew to 59%, for a total increase of 13 percentage points. Finally, over the same period of time, the percentage of Republicans reporting that they would be more likely to vote for a candidate engaged in election denial dropped from 34% to 25%. On the whole, these findings suggest that election denial may be a less effective way to win Republican votes now than it was a year ago.
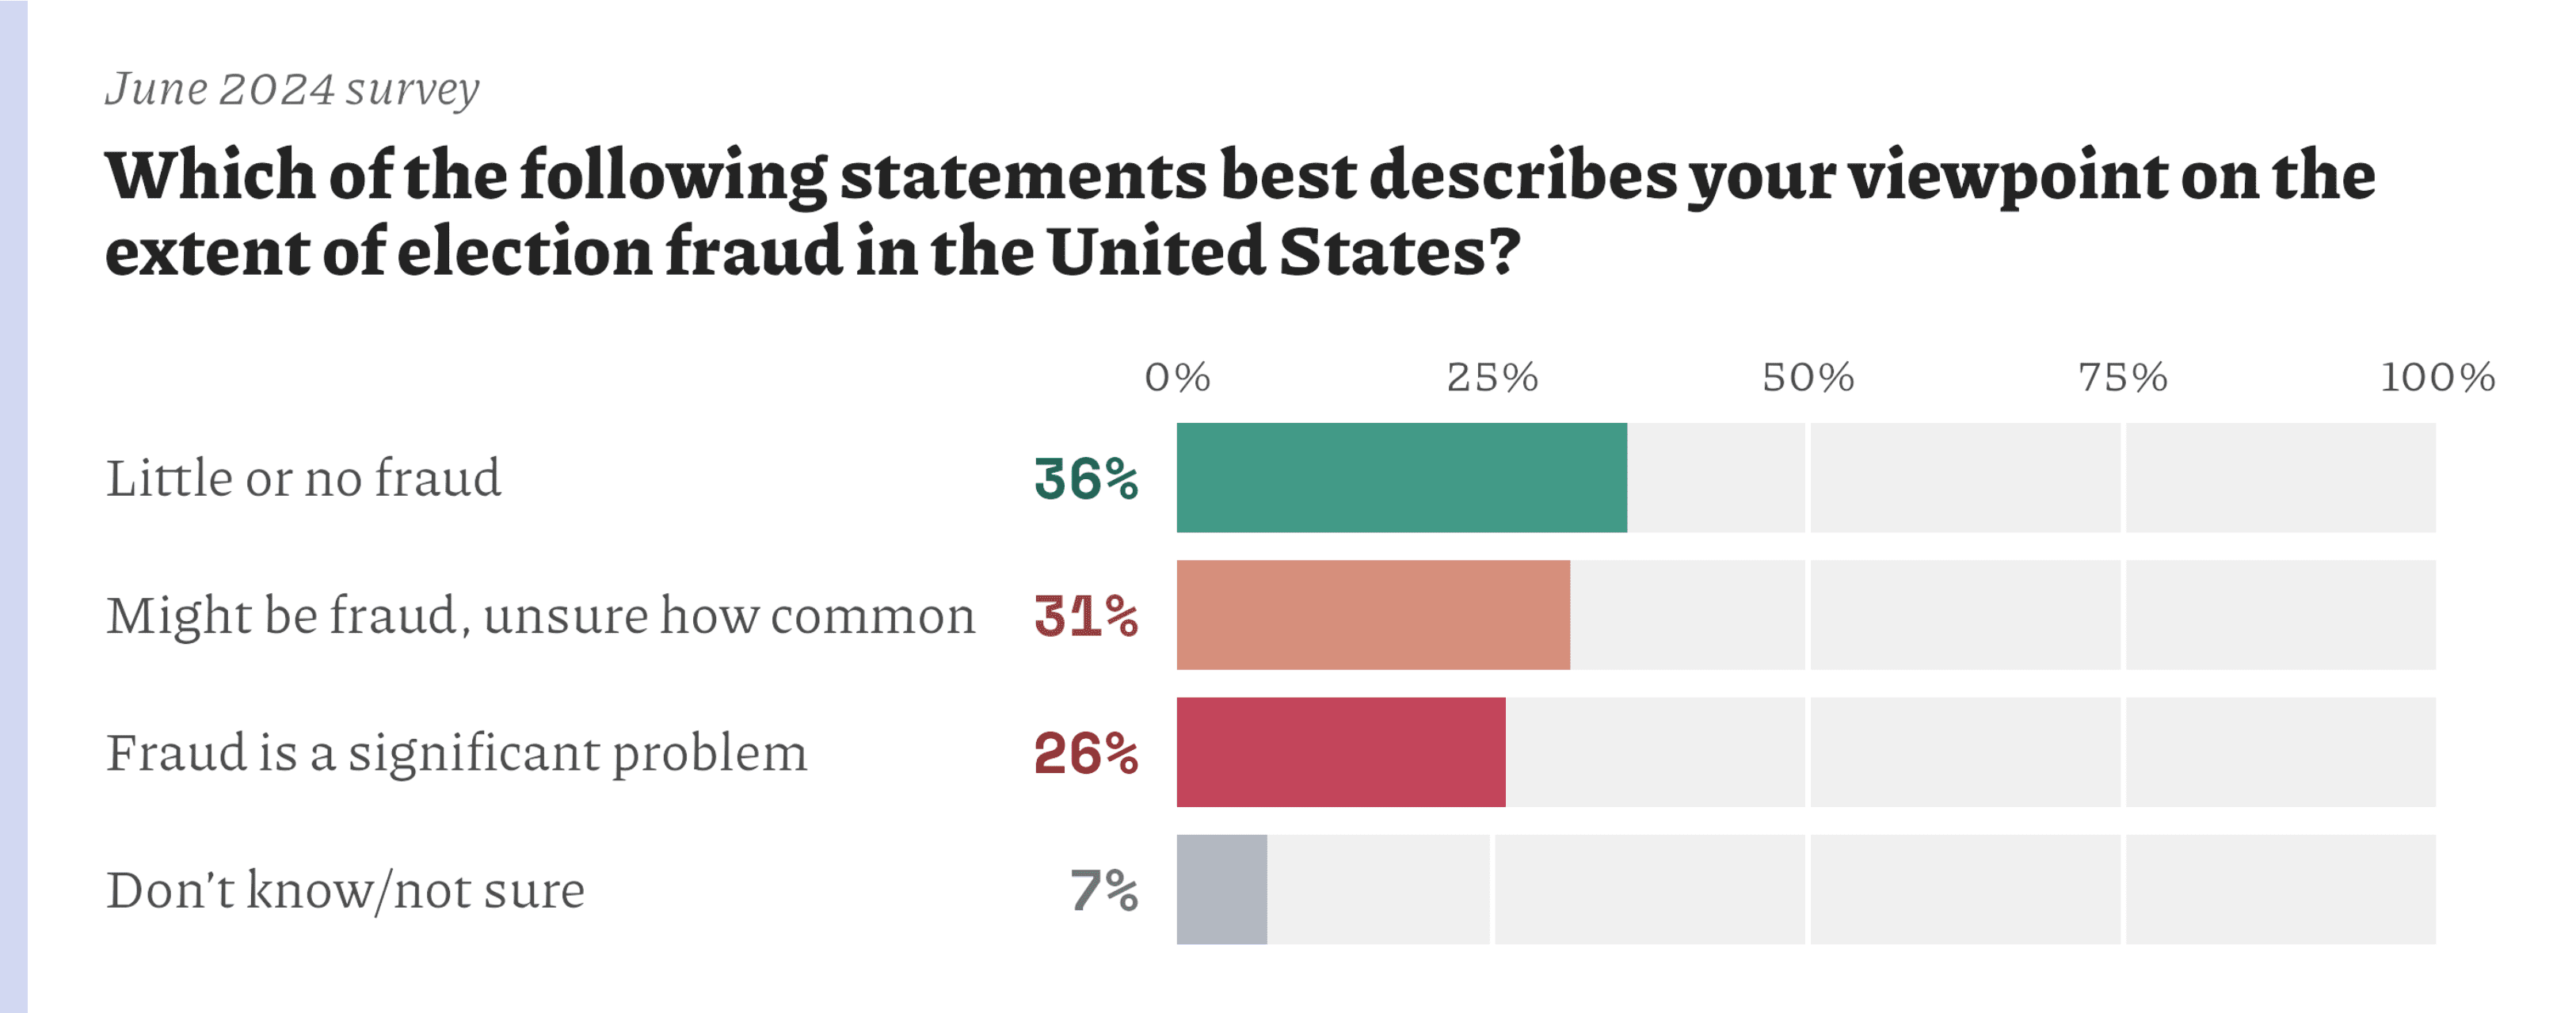
A plurality of Americans (36%) in June 2024 say there is little or no election fraud in the United States.
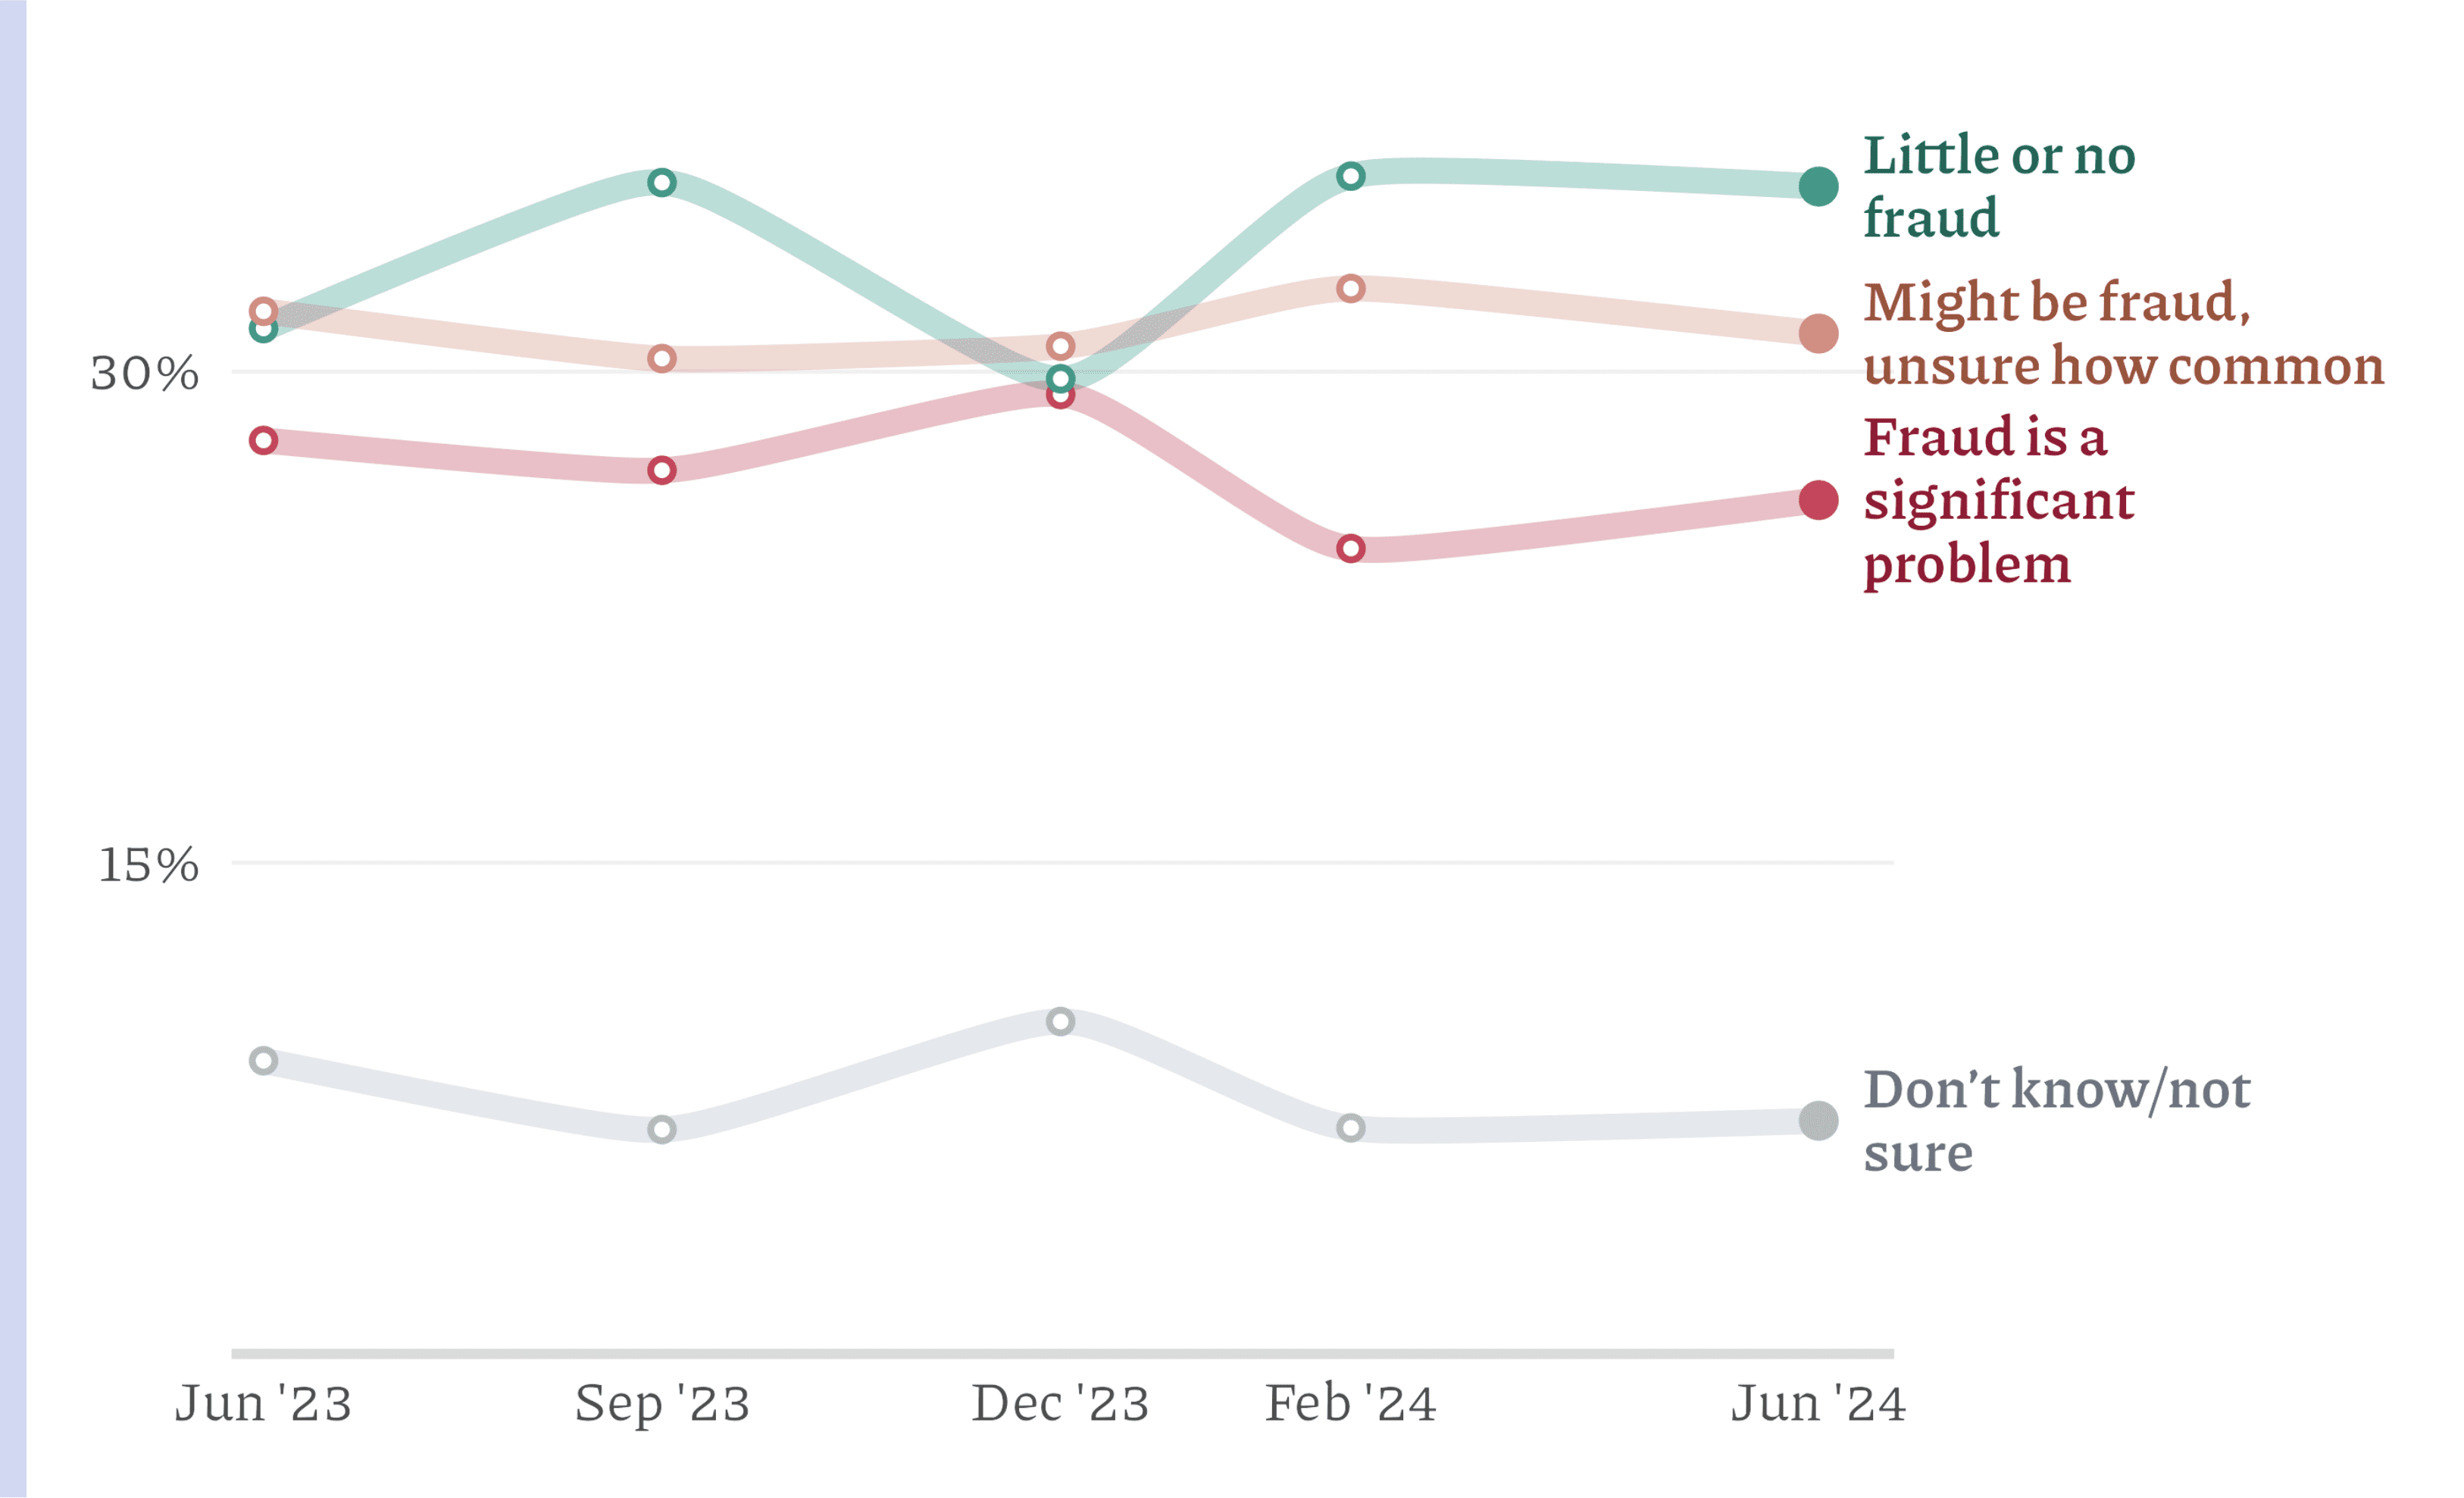
This finding is stable over time, as can be seen below.
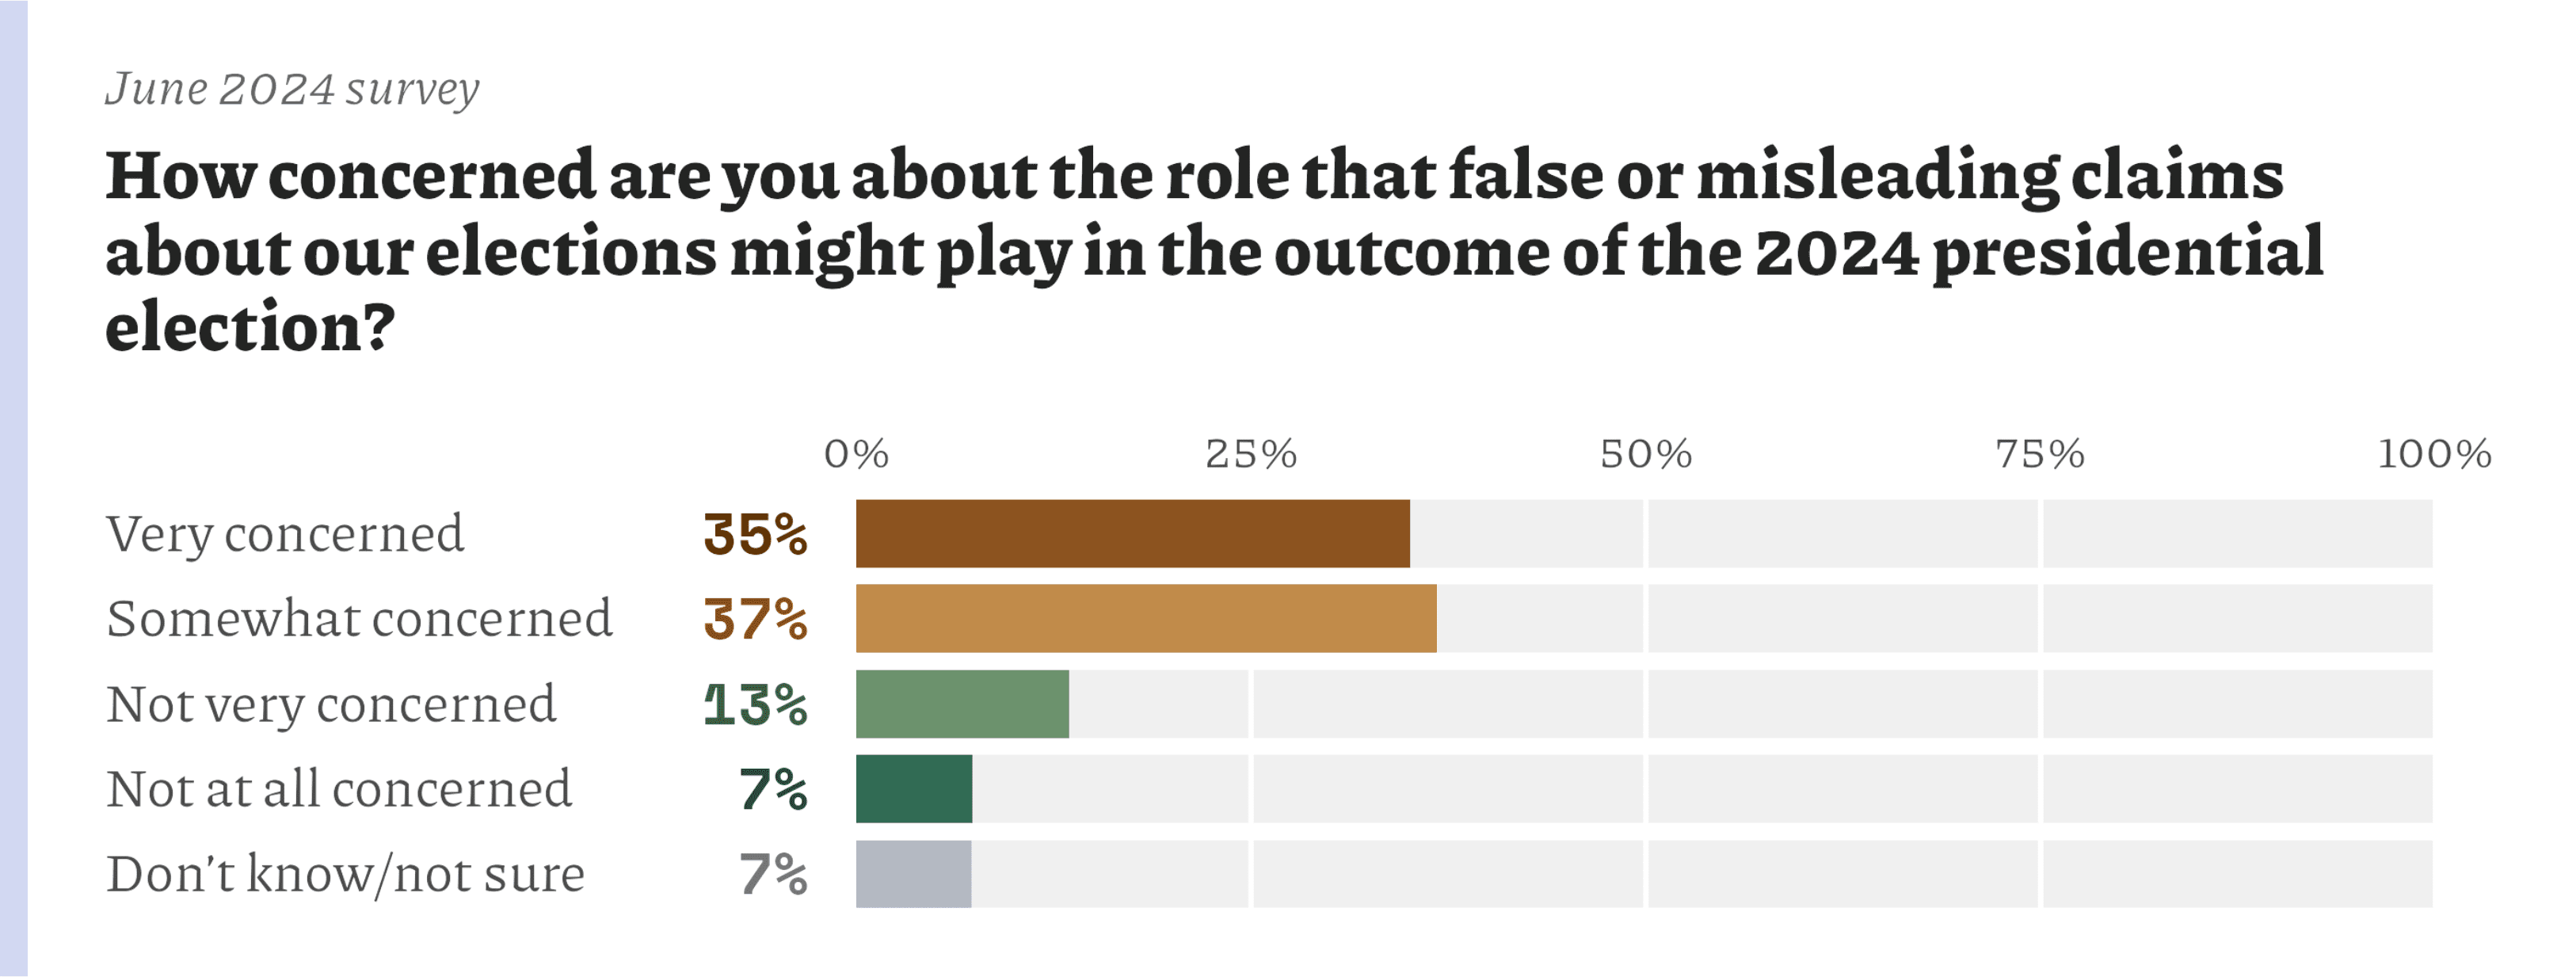
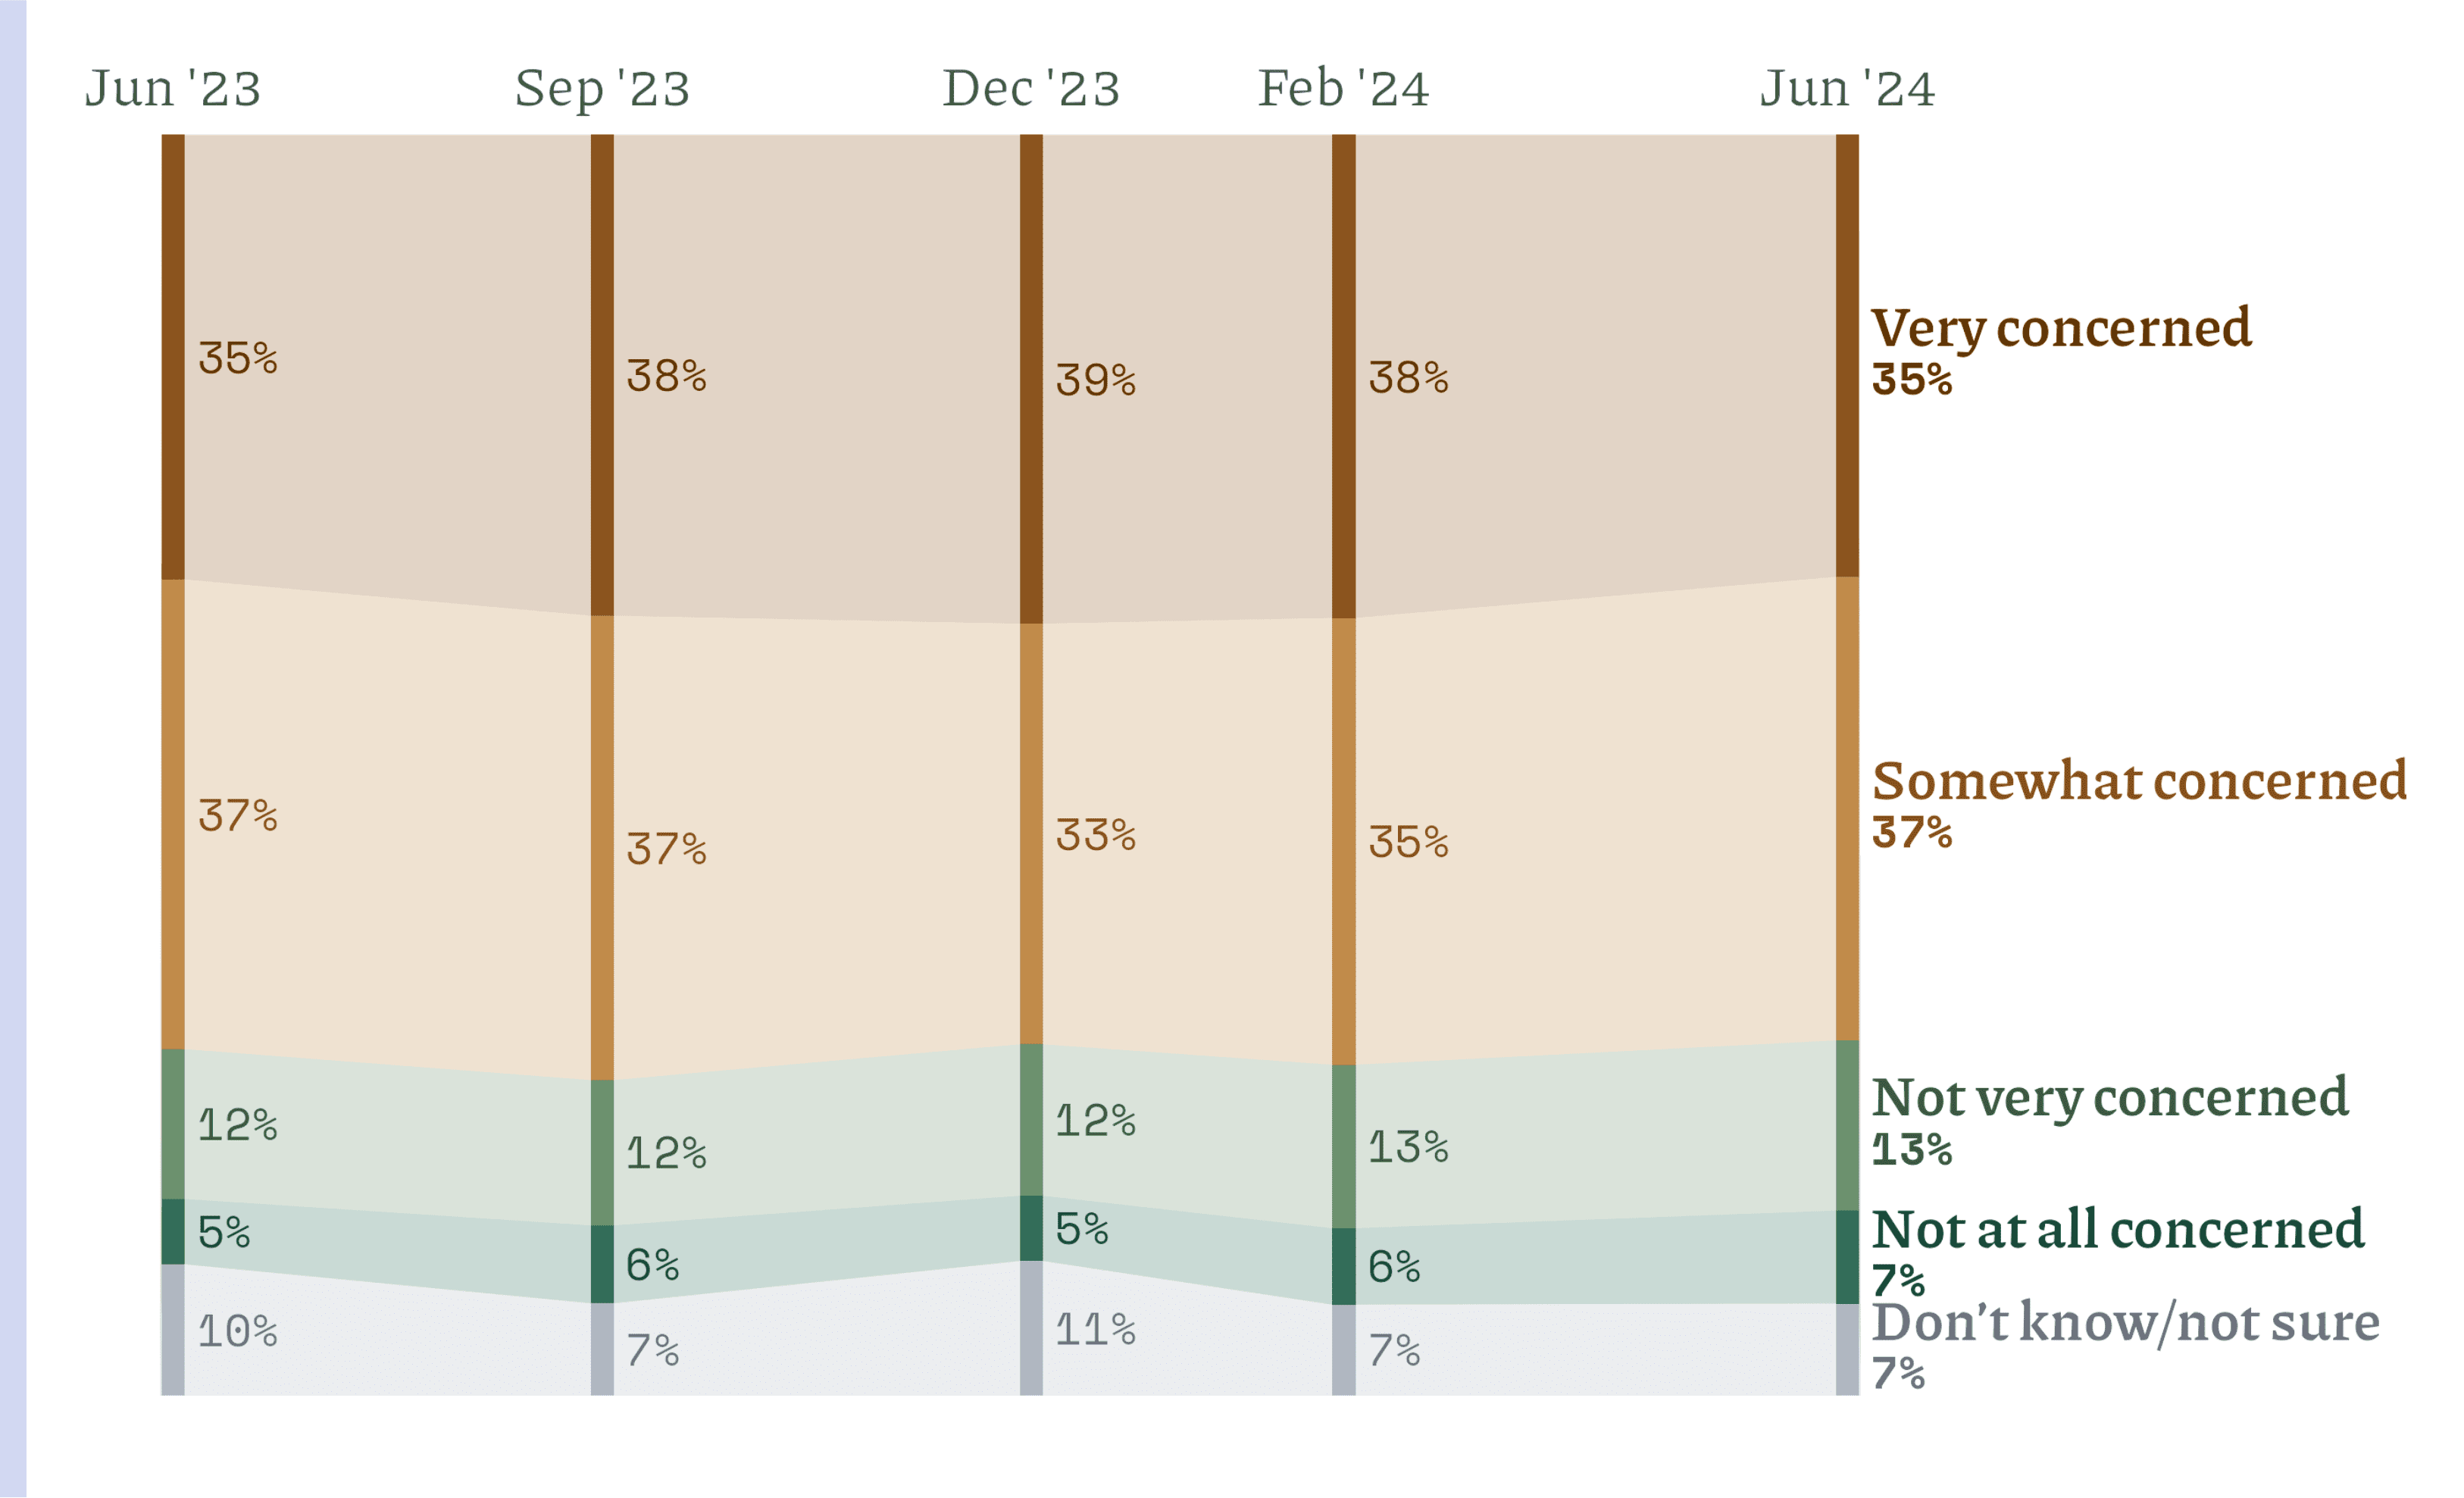
Most Americans—about 72% in June 2024—are very or somewhat concerned about false or misleading election claims. Only about 7% report feeling not at all concerned about this matter. As shown by the second plot in this section, these attitudes demonstrate remarkable stability over time.
Consistency Across Partisan Groups
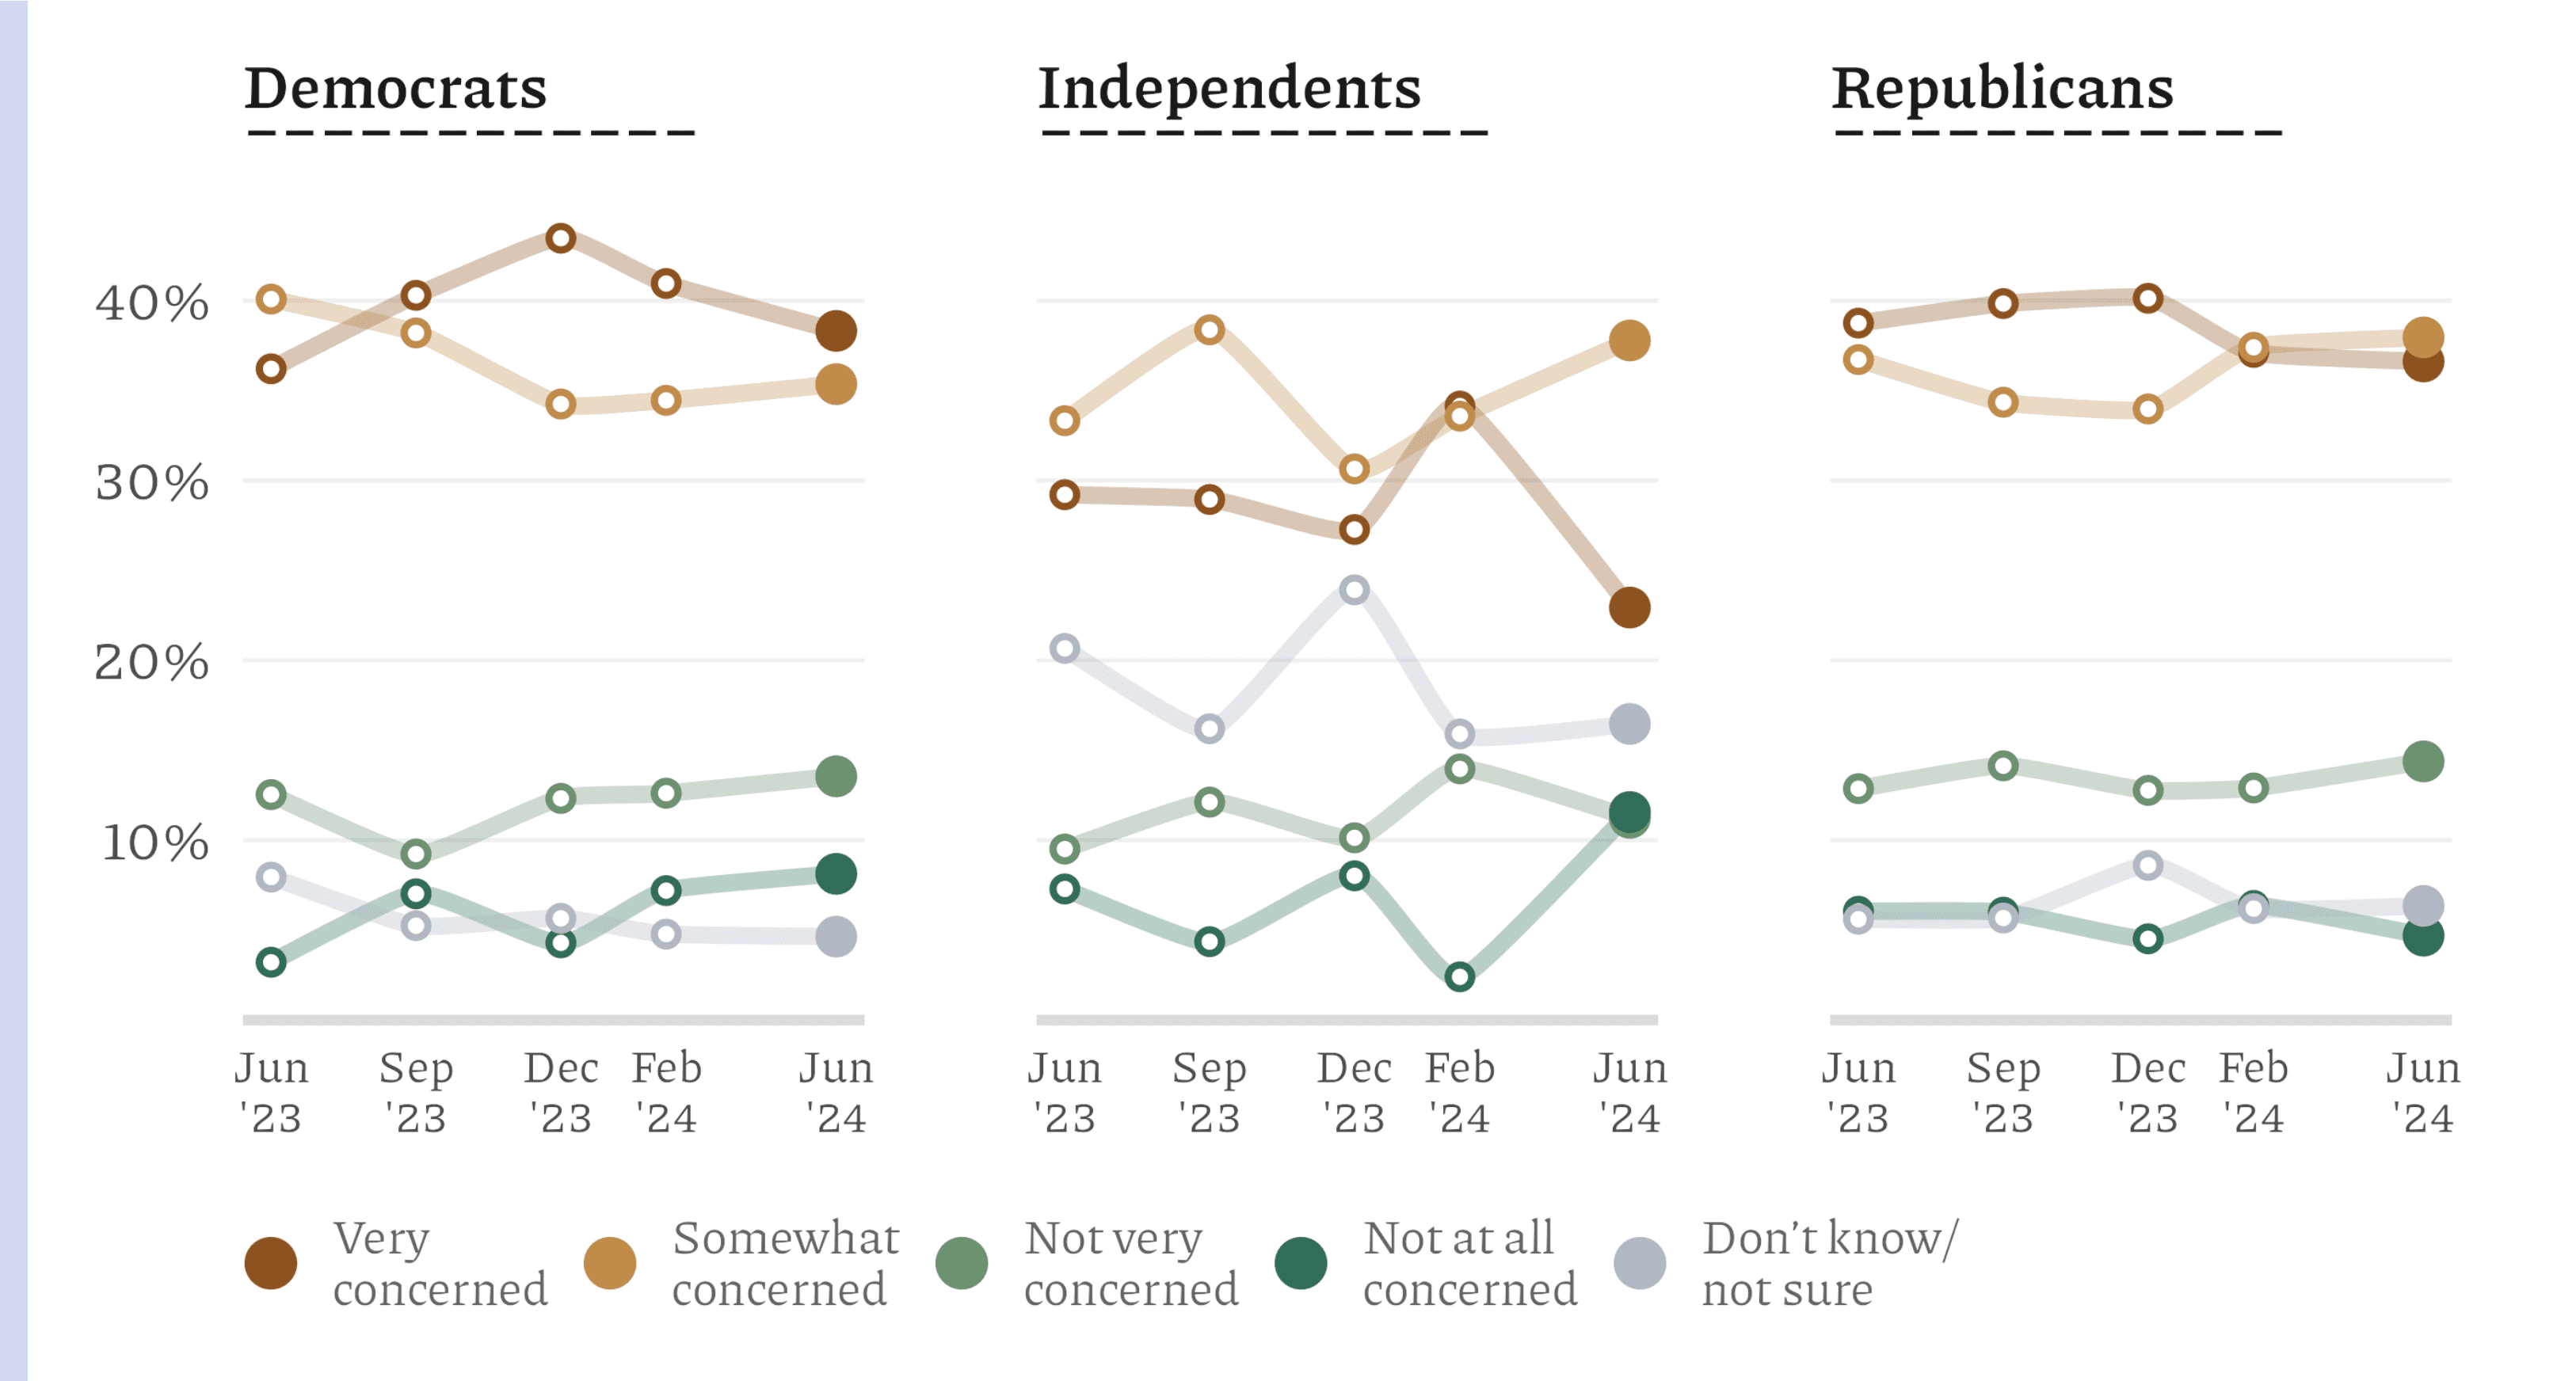
Majorities of Republicans, Democrats, and independents report feeling somewhat or very concerned that false or misleading information might affect the outcome 2024 presidential election.
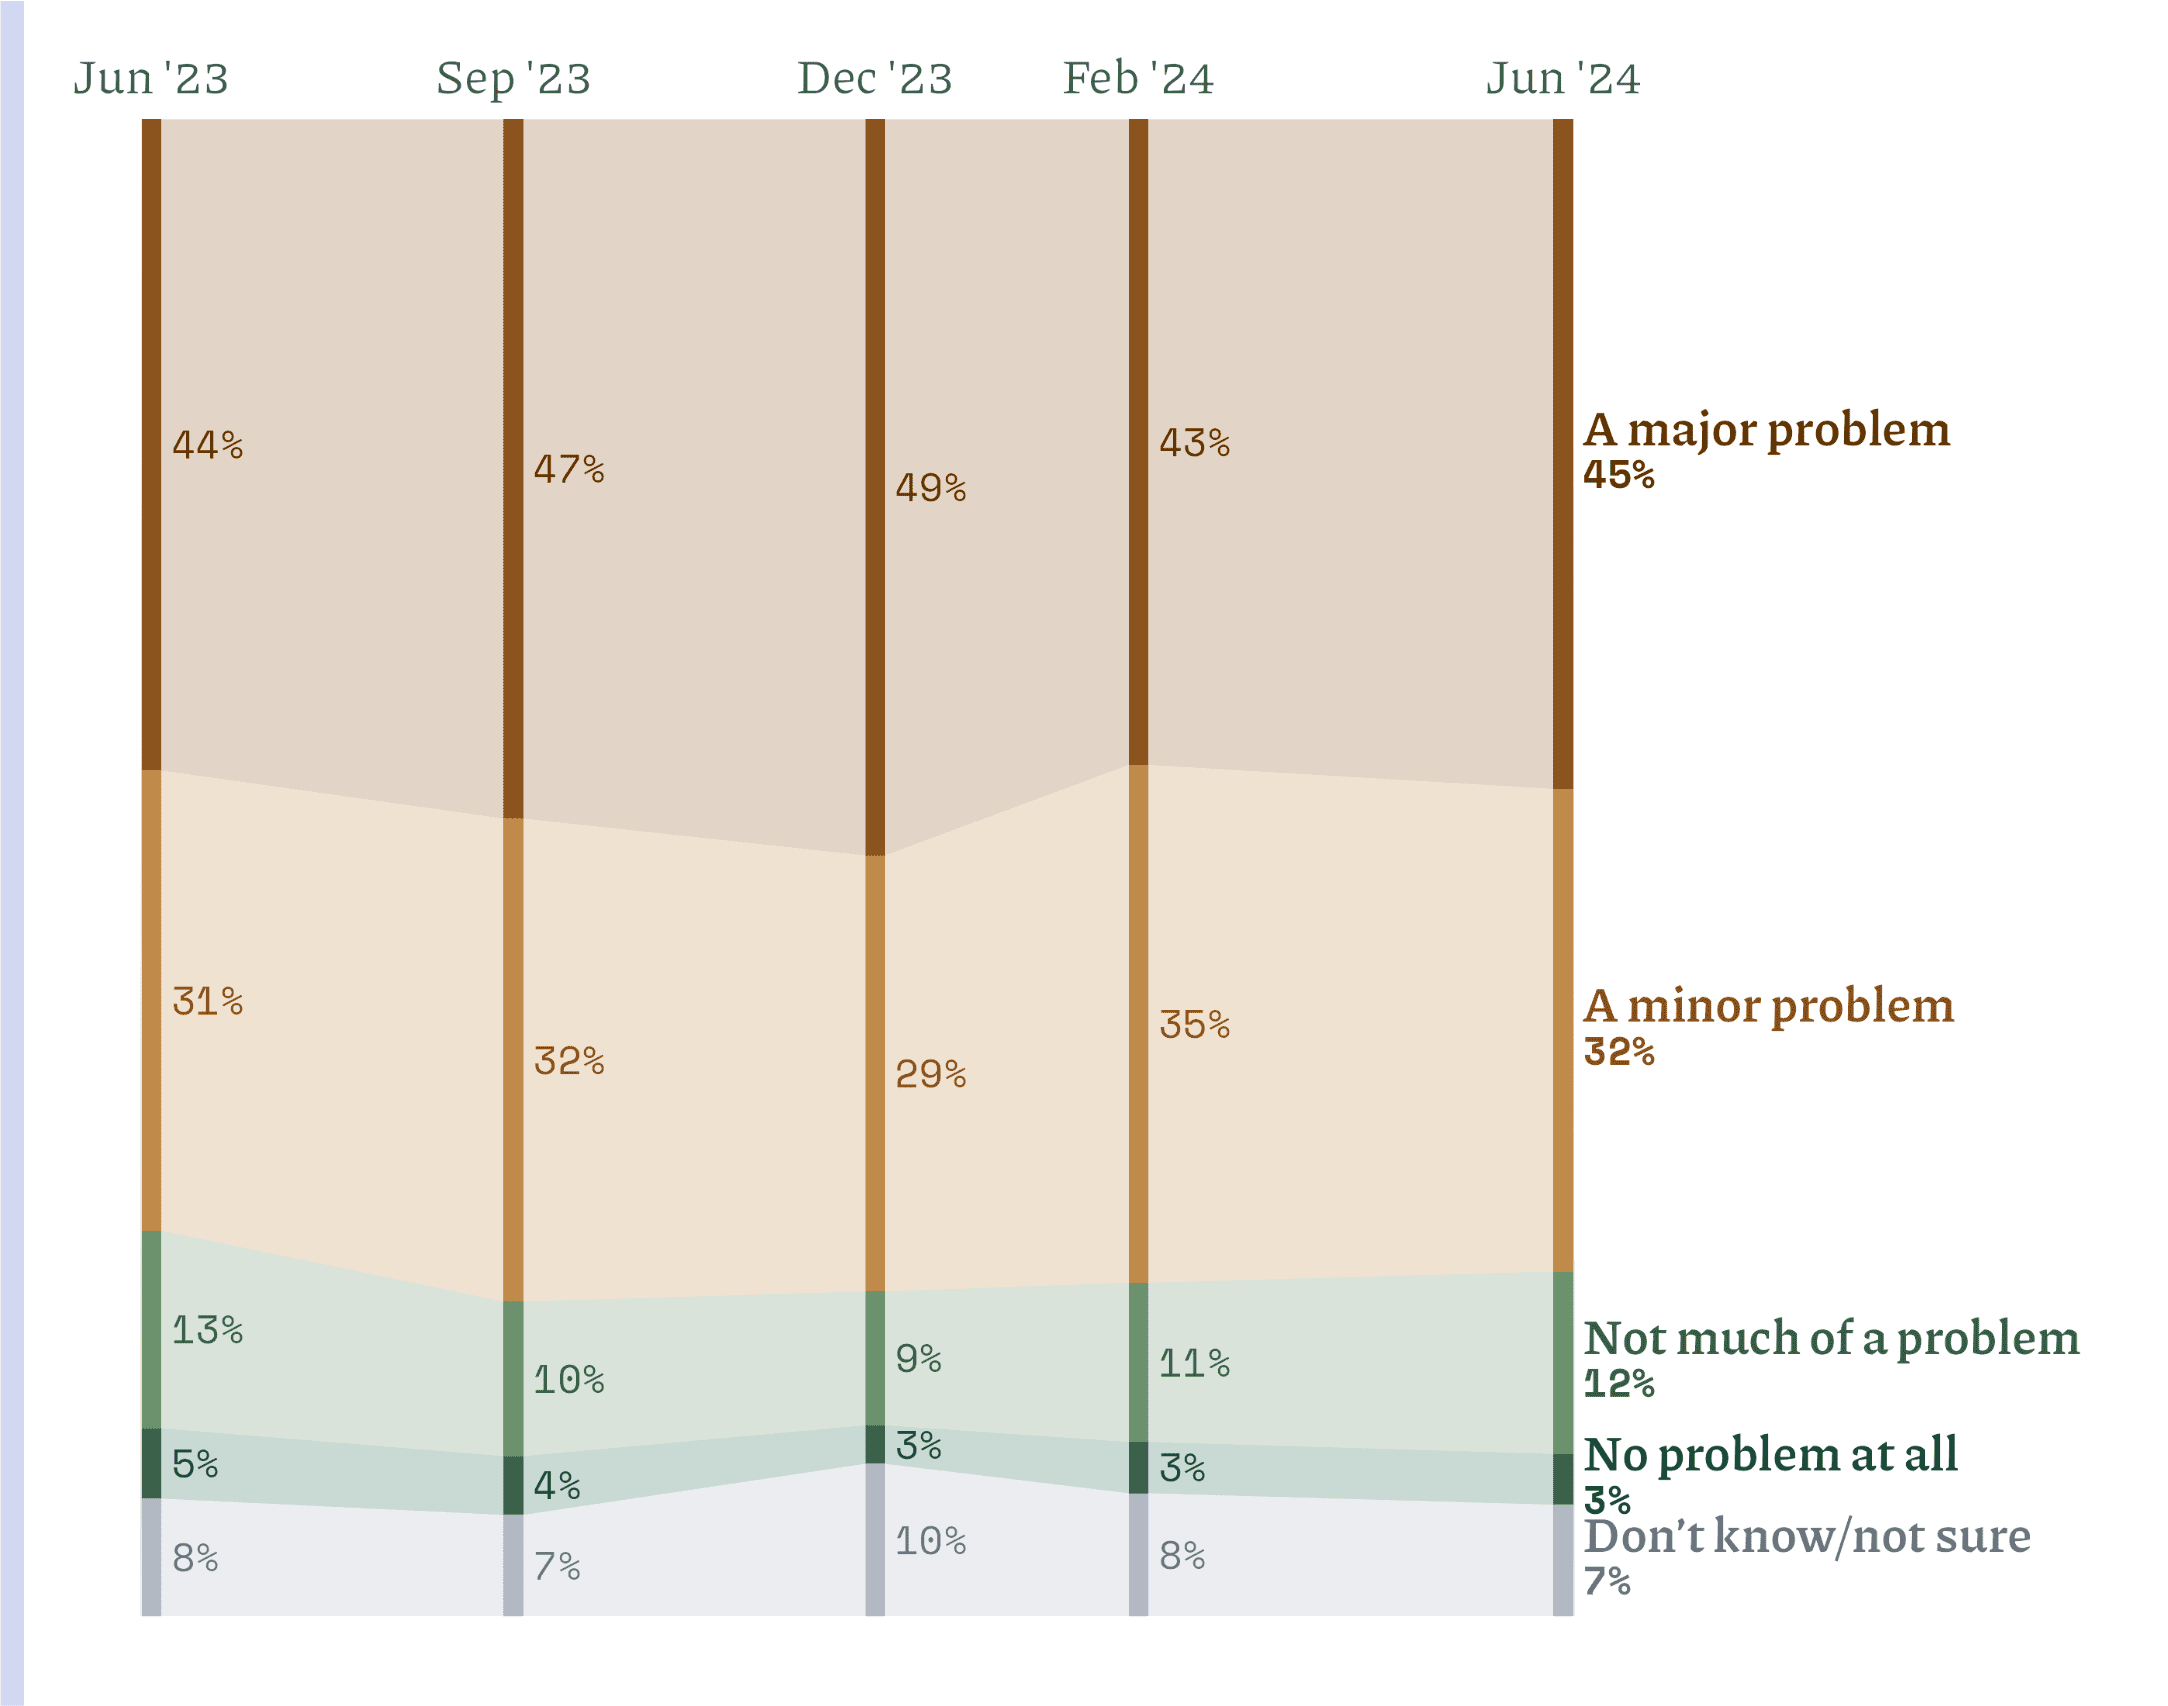
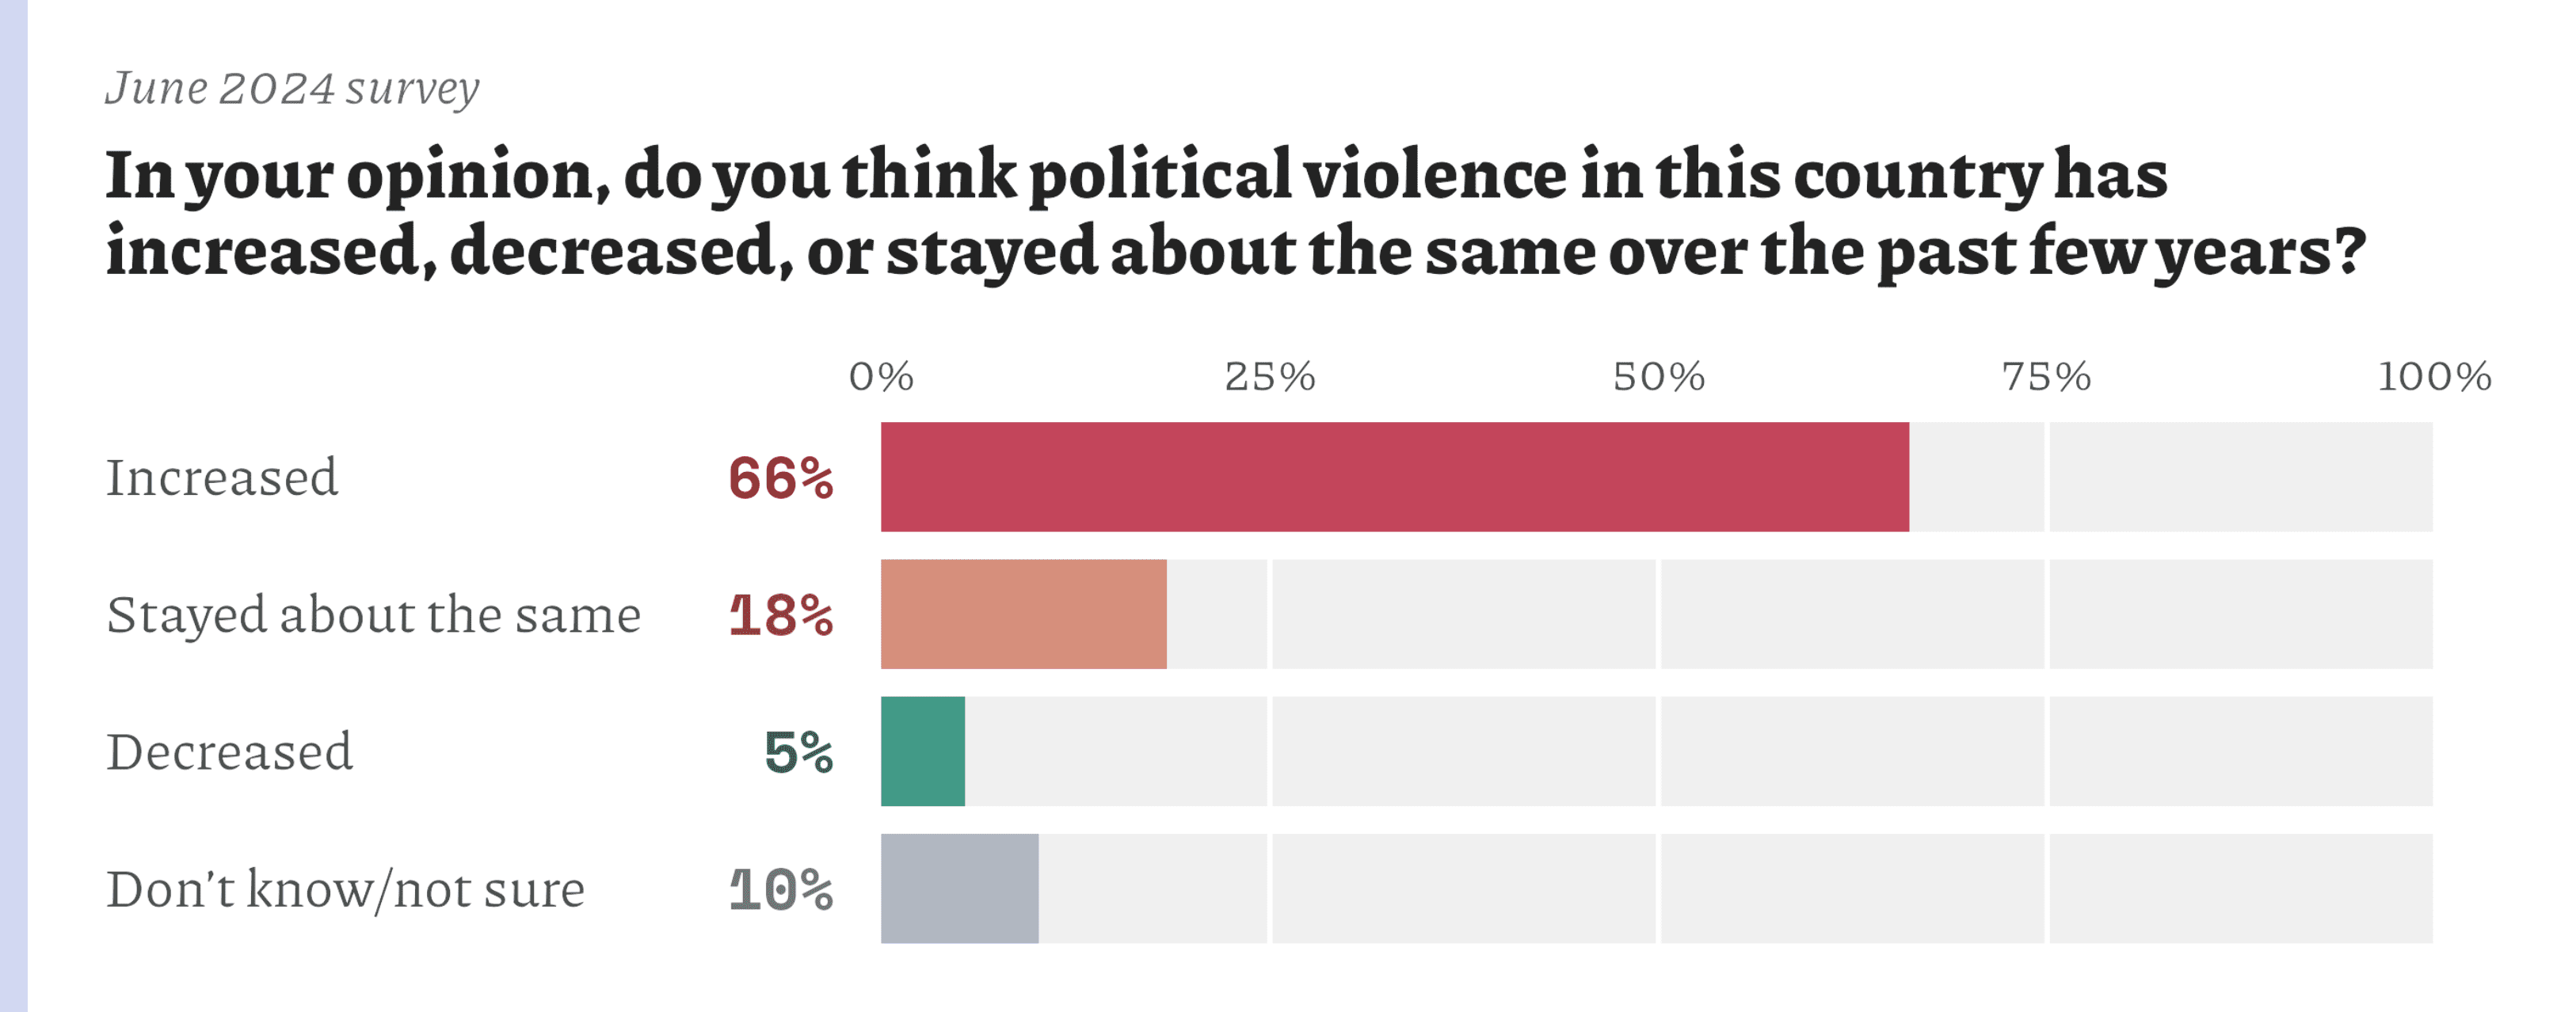
Even before this summer’s assassination attempt against former President Trump, Americans recognized political violence as a problem for our democracy. A plurality of Americans say that political violence is a major problem (45% in June 2024), and large majorities say that it’s at least a minor problem. These findings are generally stable over time.

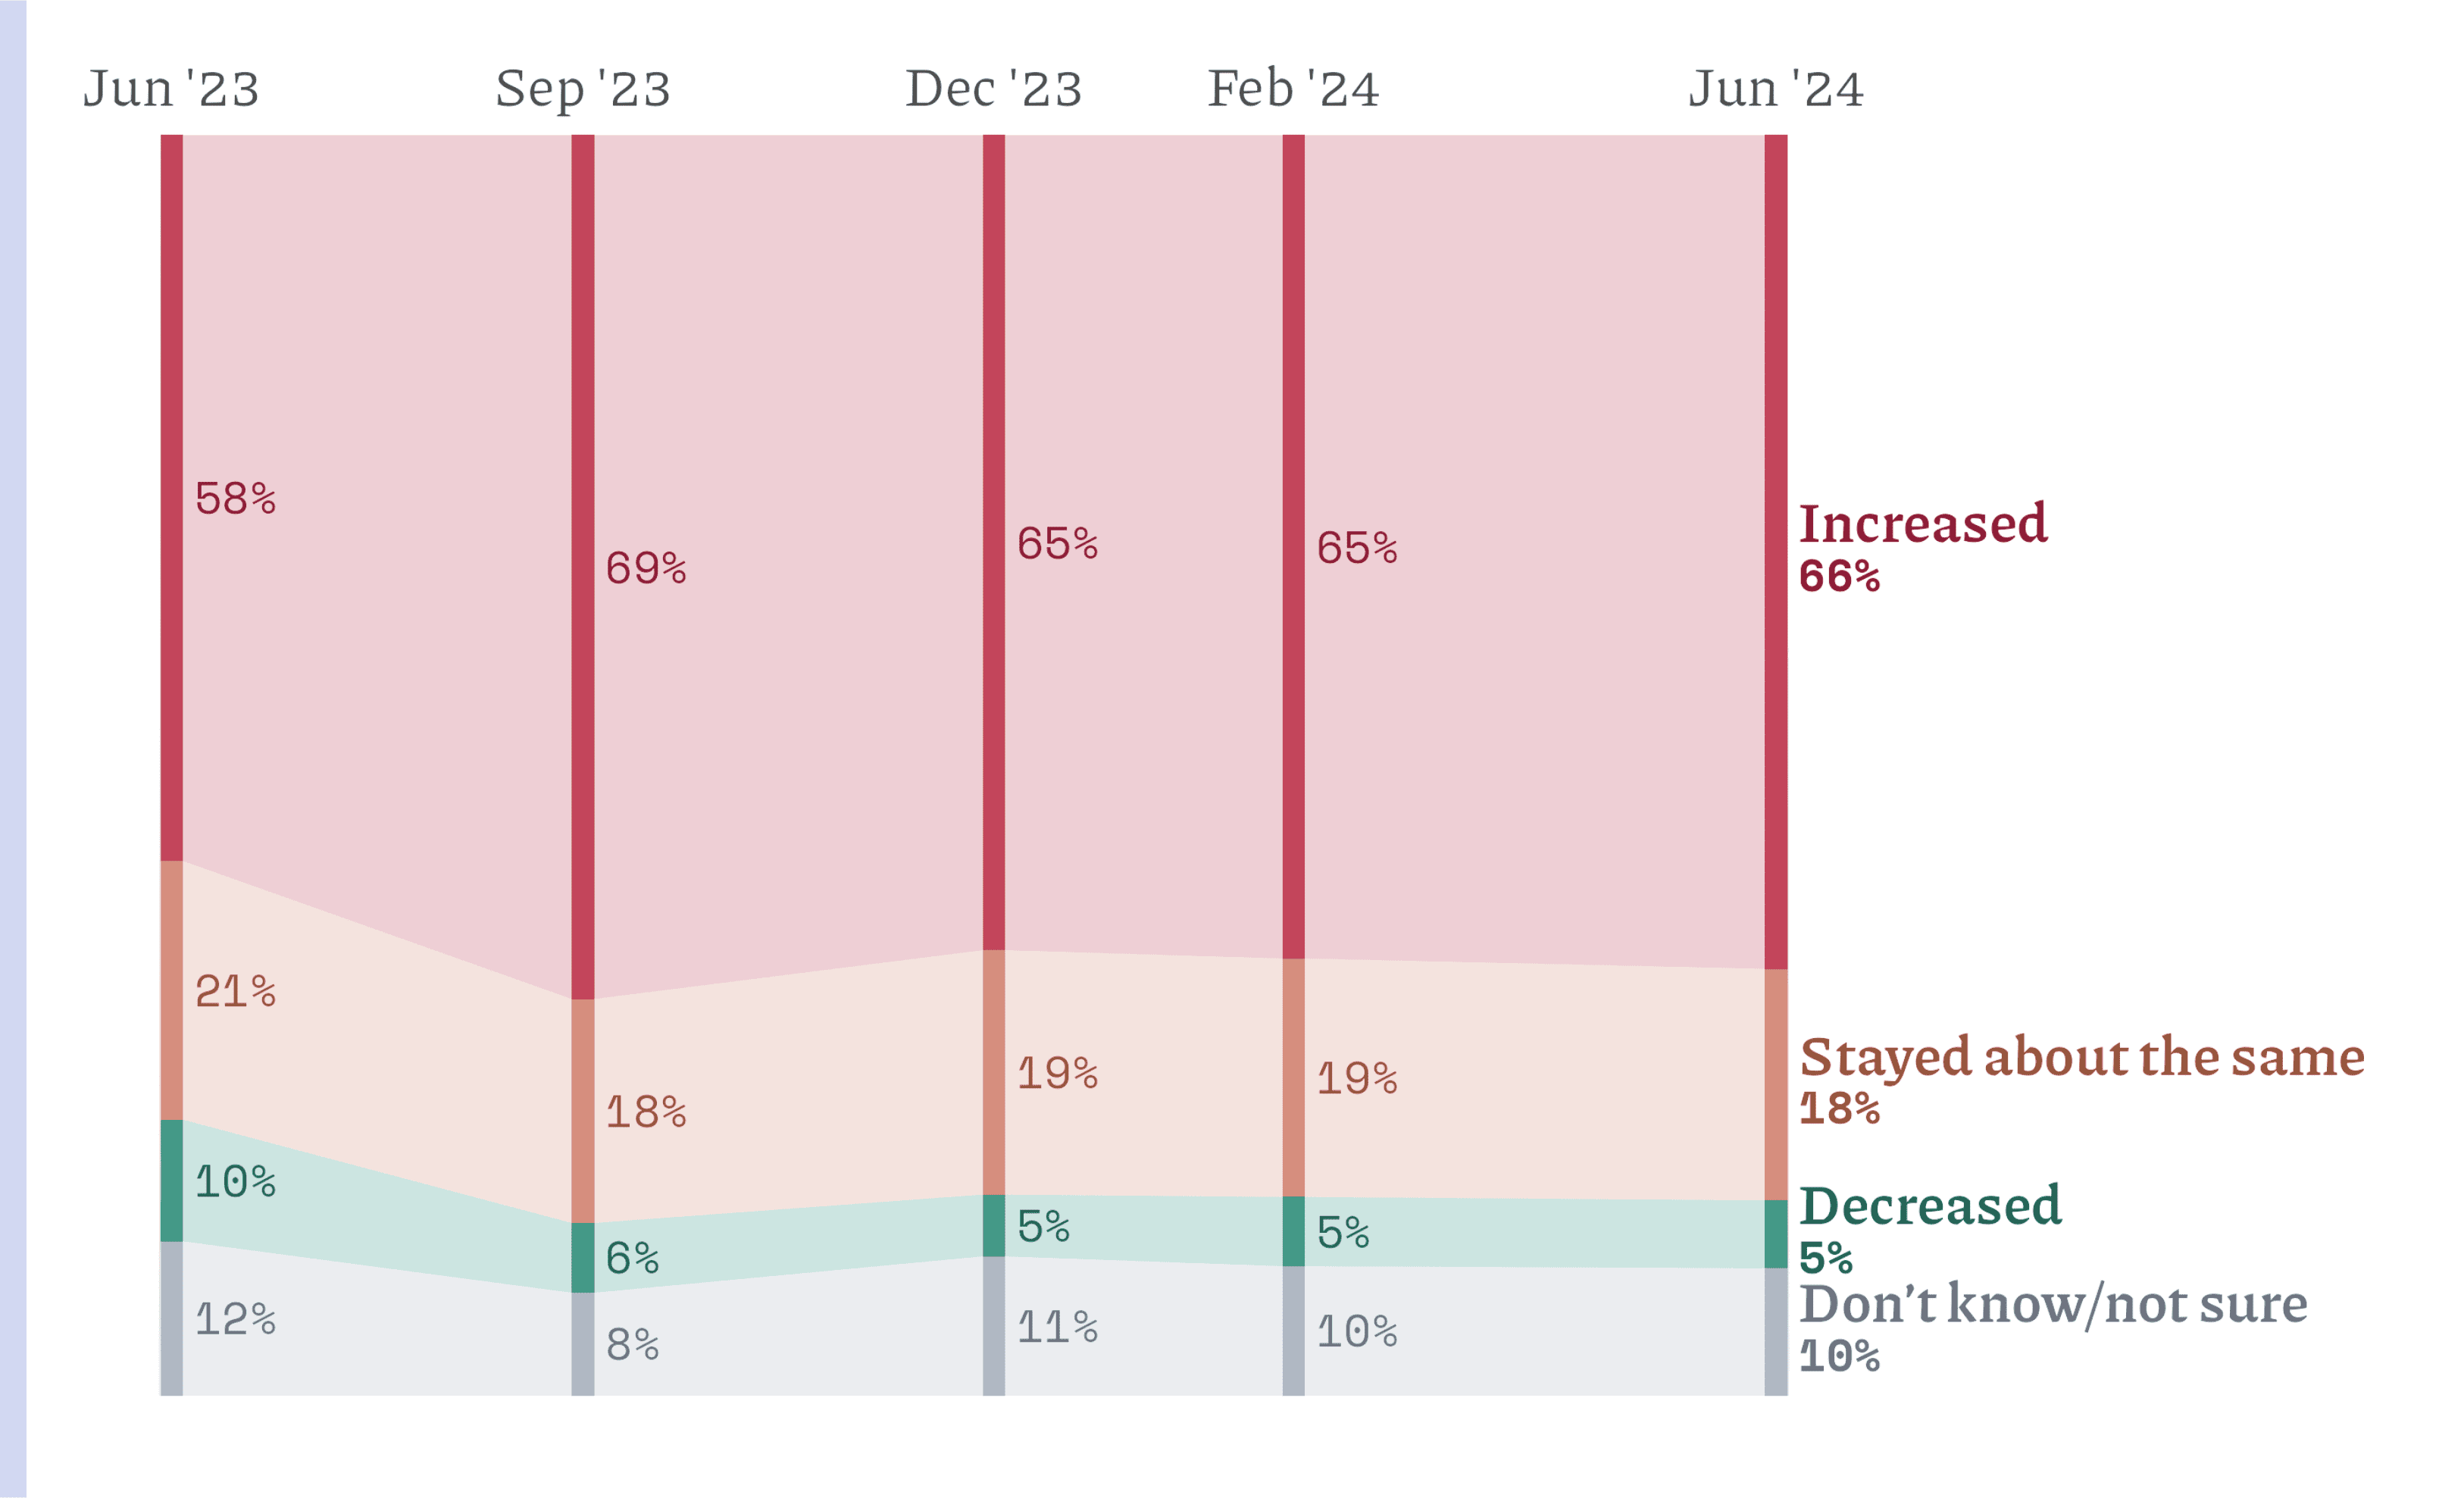
Most Americans also believe political violence has increased over the past few years. The proportion who say this has risen since June of 2023.
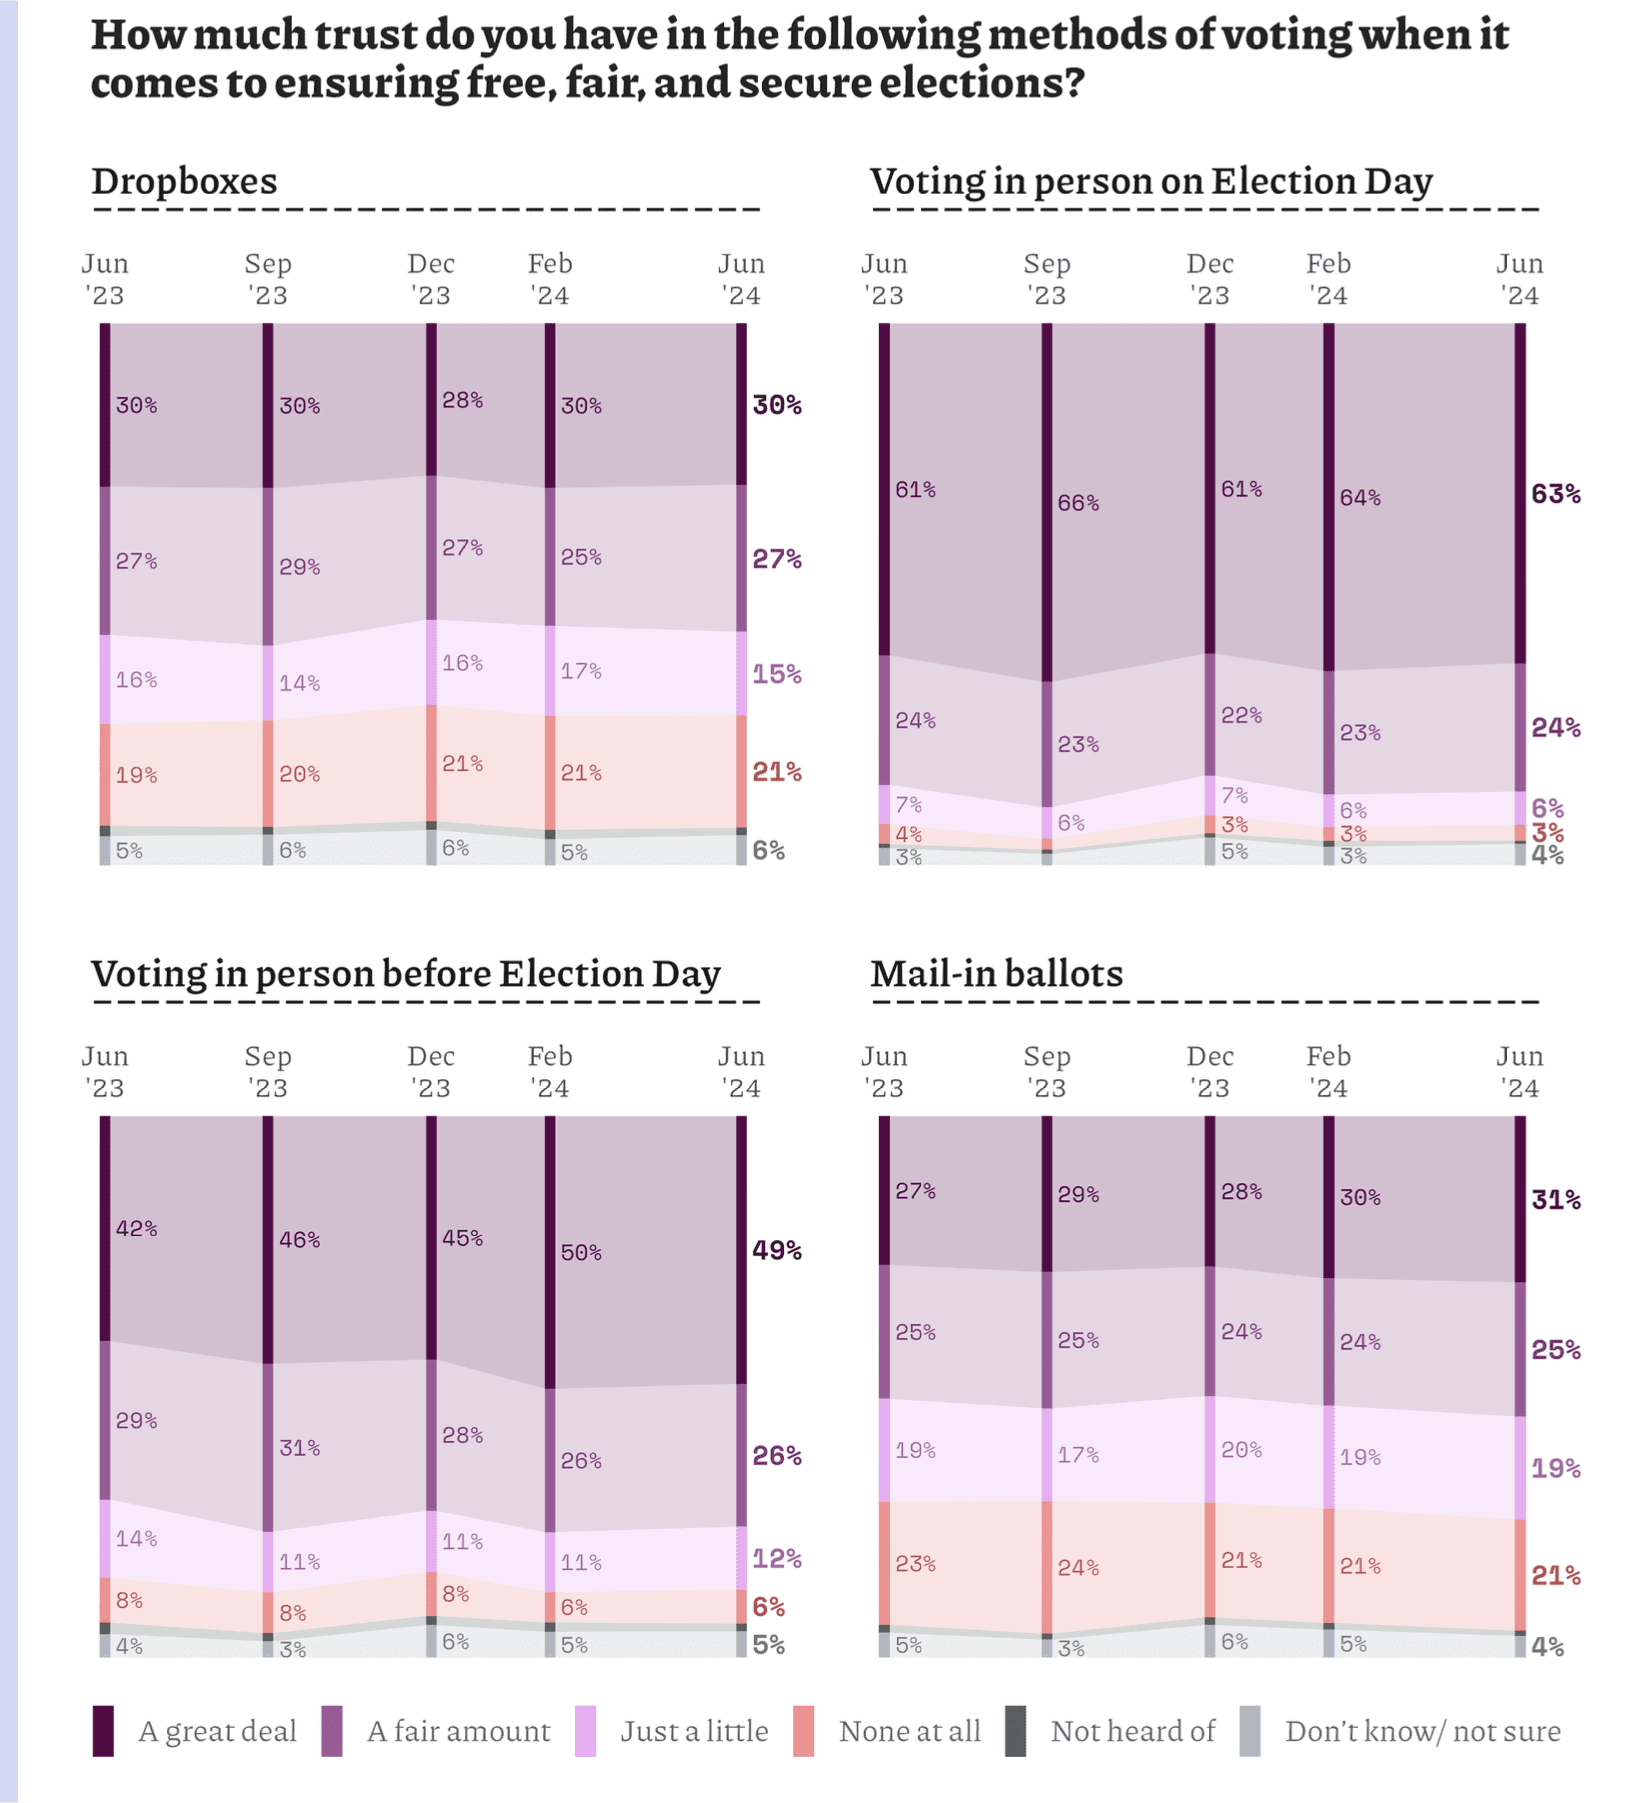
In our modern elections, Americans have a variety of ways to make their voices heard, and these findings show that voters broadly trust each of them. A majority of Americans express a great deal or a fair amount of trust in each of four methods of voting—drop boxes, mail-in ballots, in-person early voting, and in-person voting on Election Day. Attitudes haven’t changed much over time.
Americans have particularly high levels of trust in voting in person on Election Day. In the June 2024 survey, 87% had a great deal or fair amount of trust in voting this way.
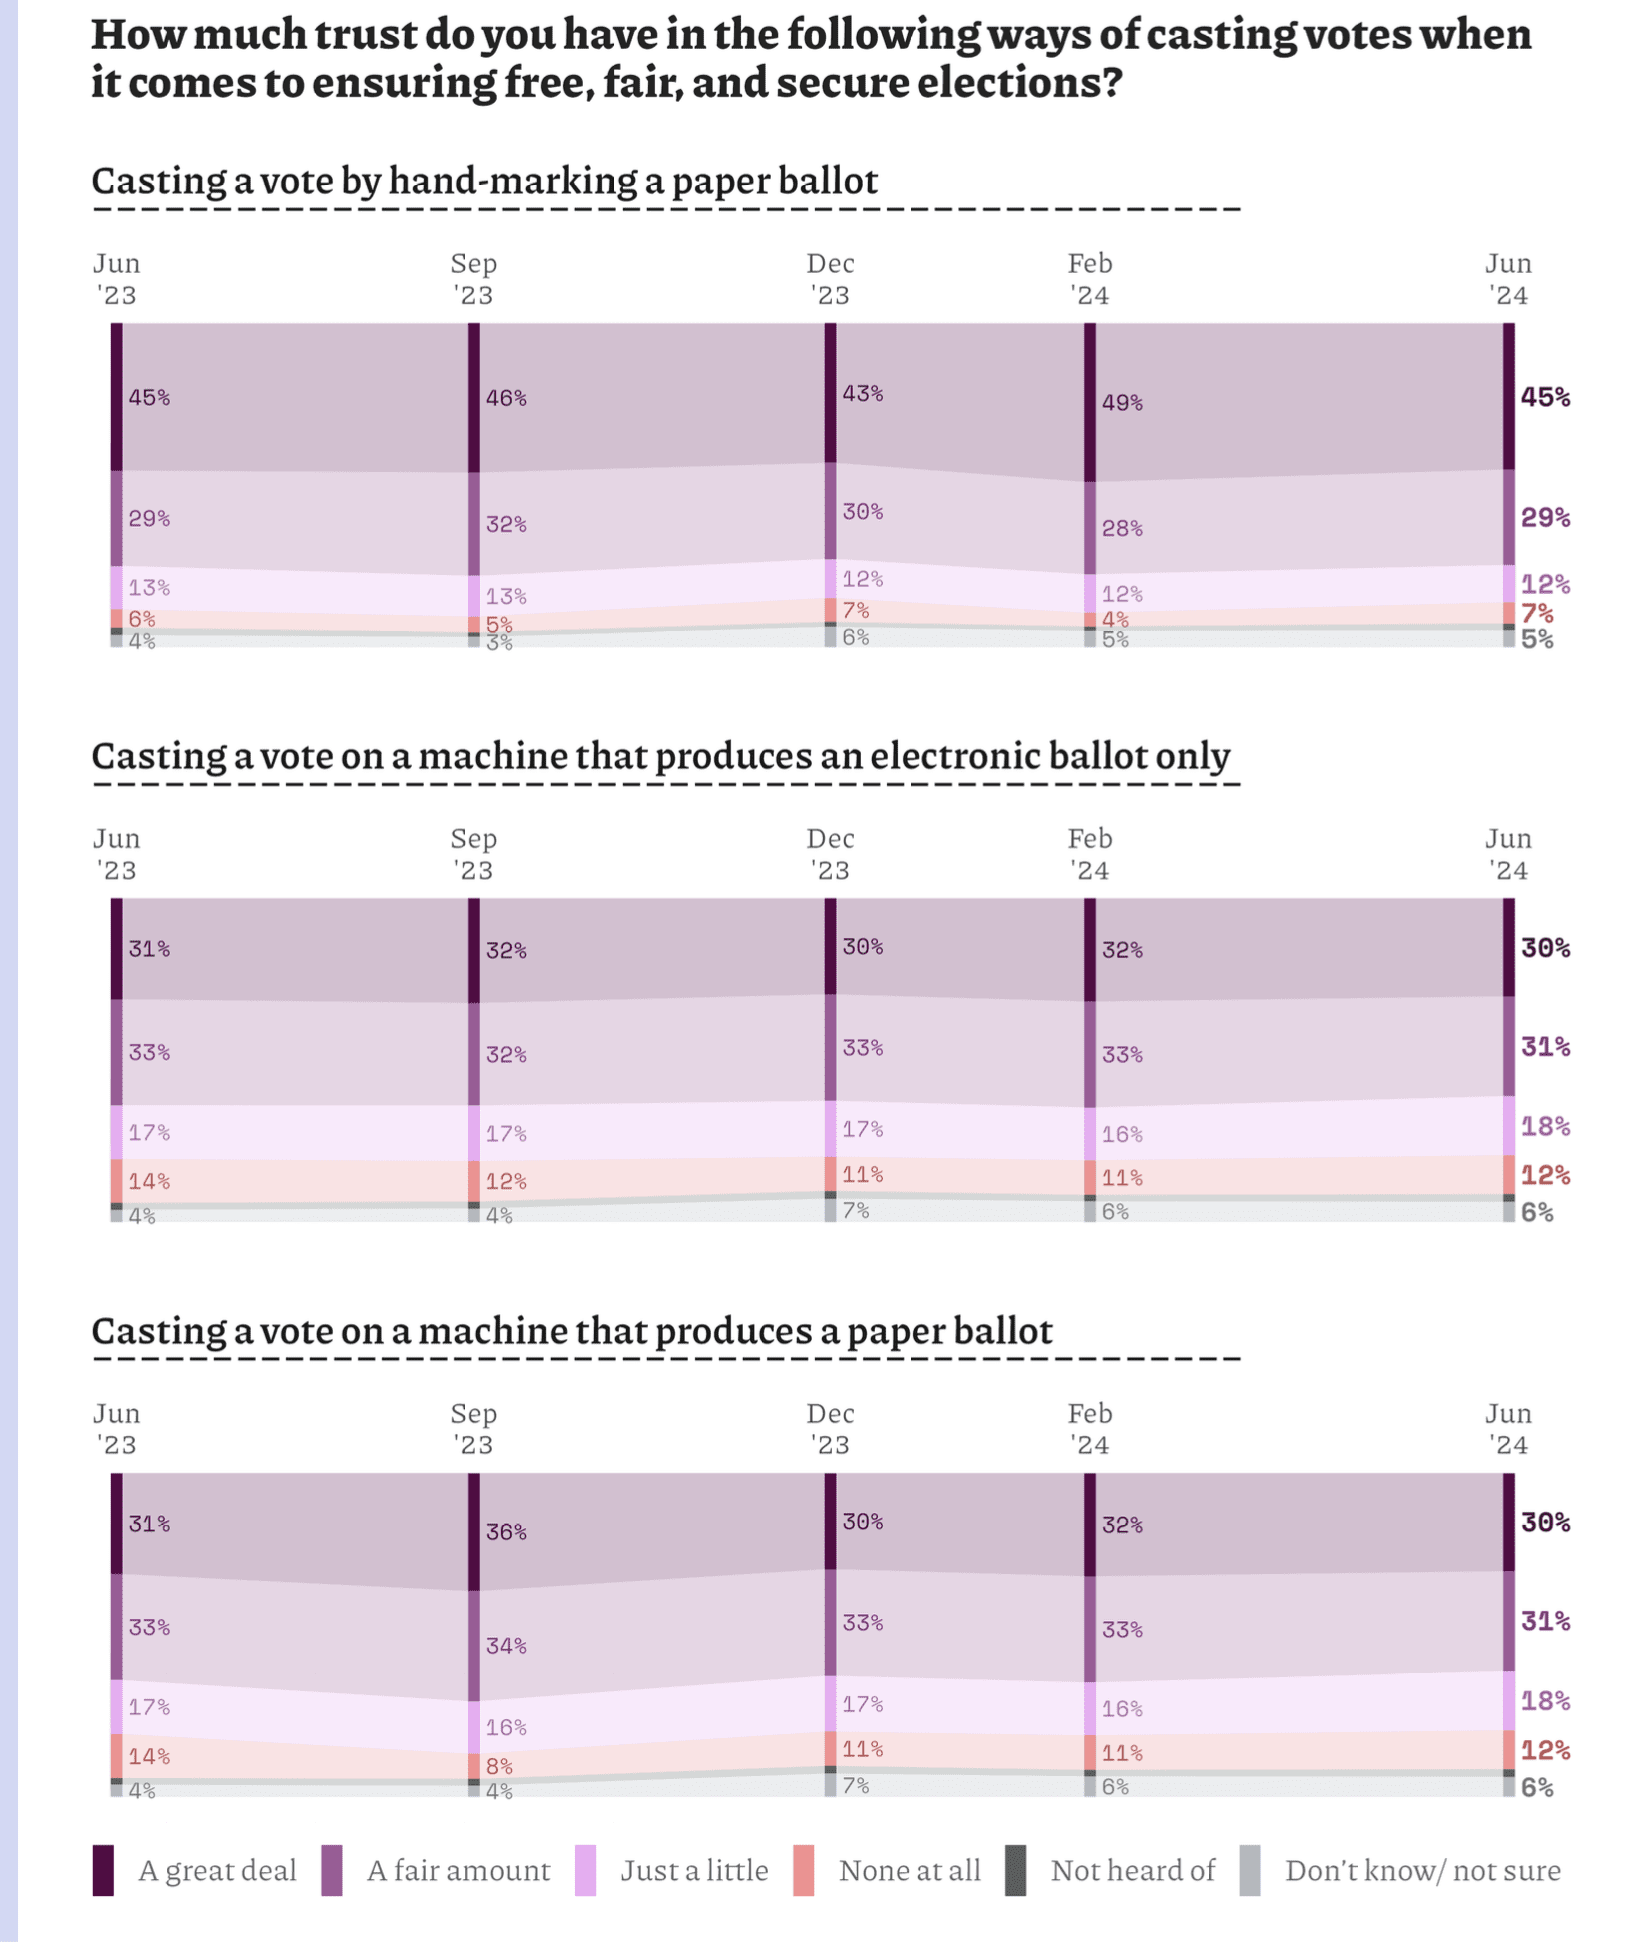
Trust is high for voting on machines that produce paper ballots, for voting on machines that produce only electronic ballots, and for hand-marking a paper ballot. Hand-marked paper ballots enjoy the highest levels of trust. Americans attitudes on these items appears to be stable over time.
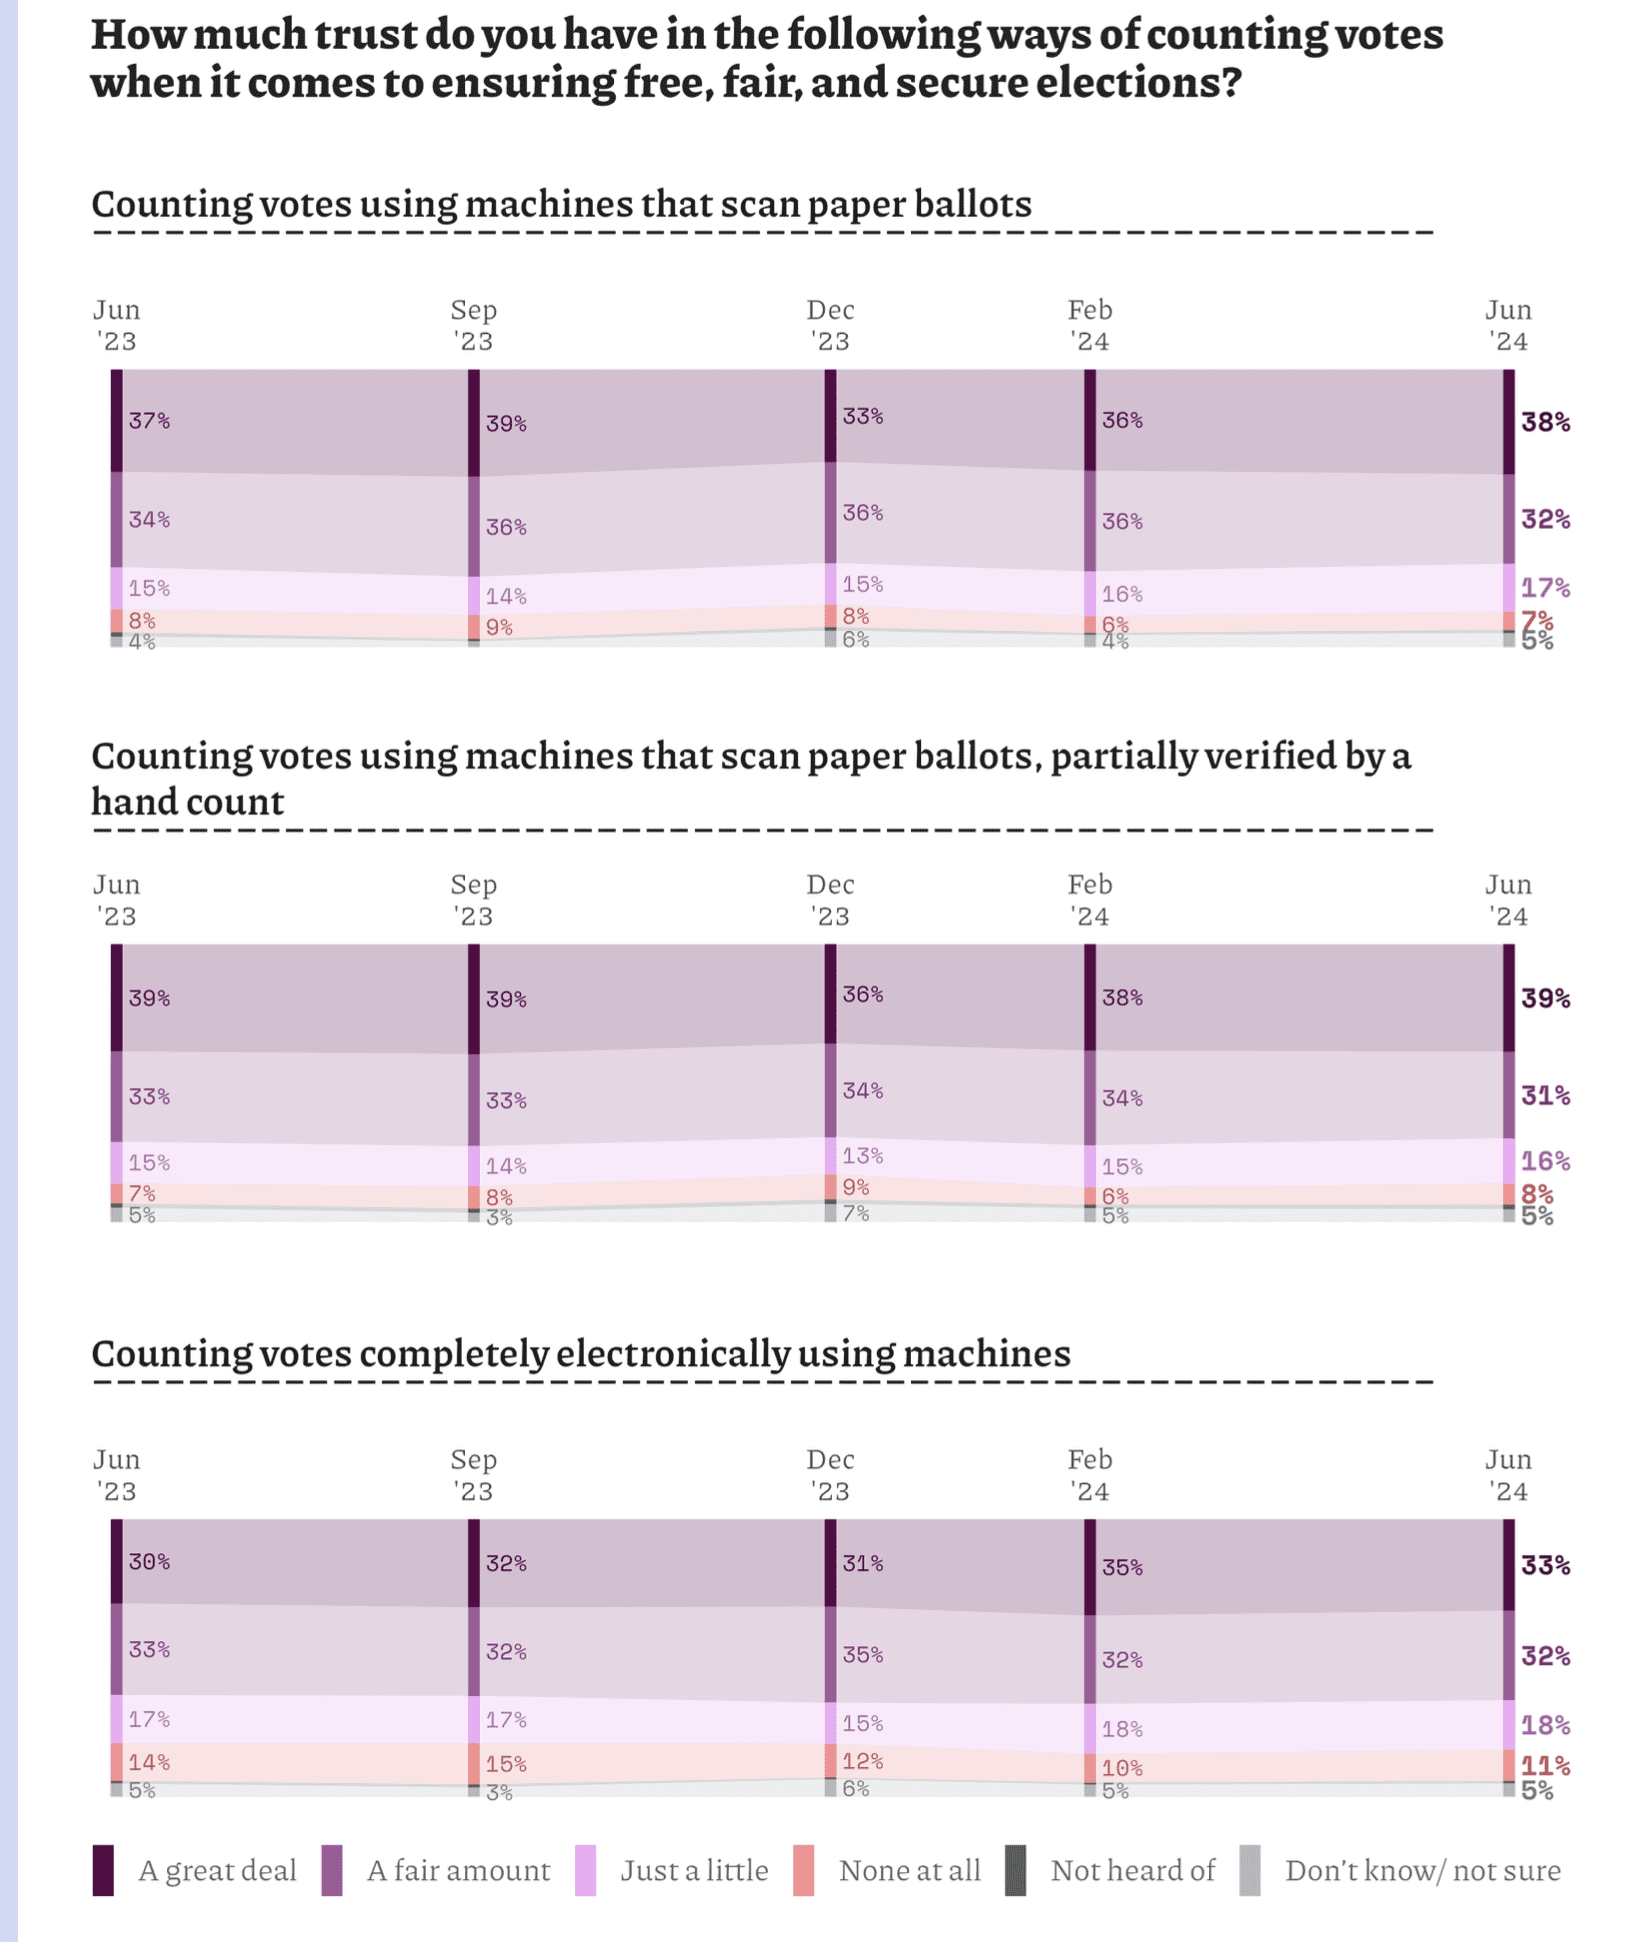
Americans also report high levels of trust in several methods of counting votes that are commonly used throughout the country. Trust was high for counting electronically, for using machines to scan paper ballots, and for scanning paper ballots along with a partial hand count for verification.
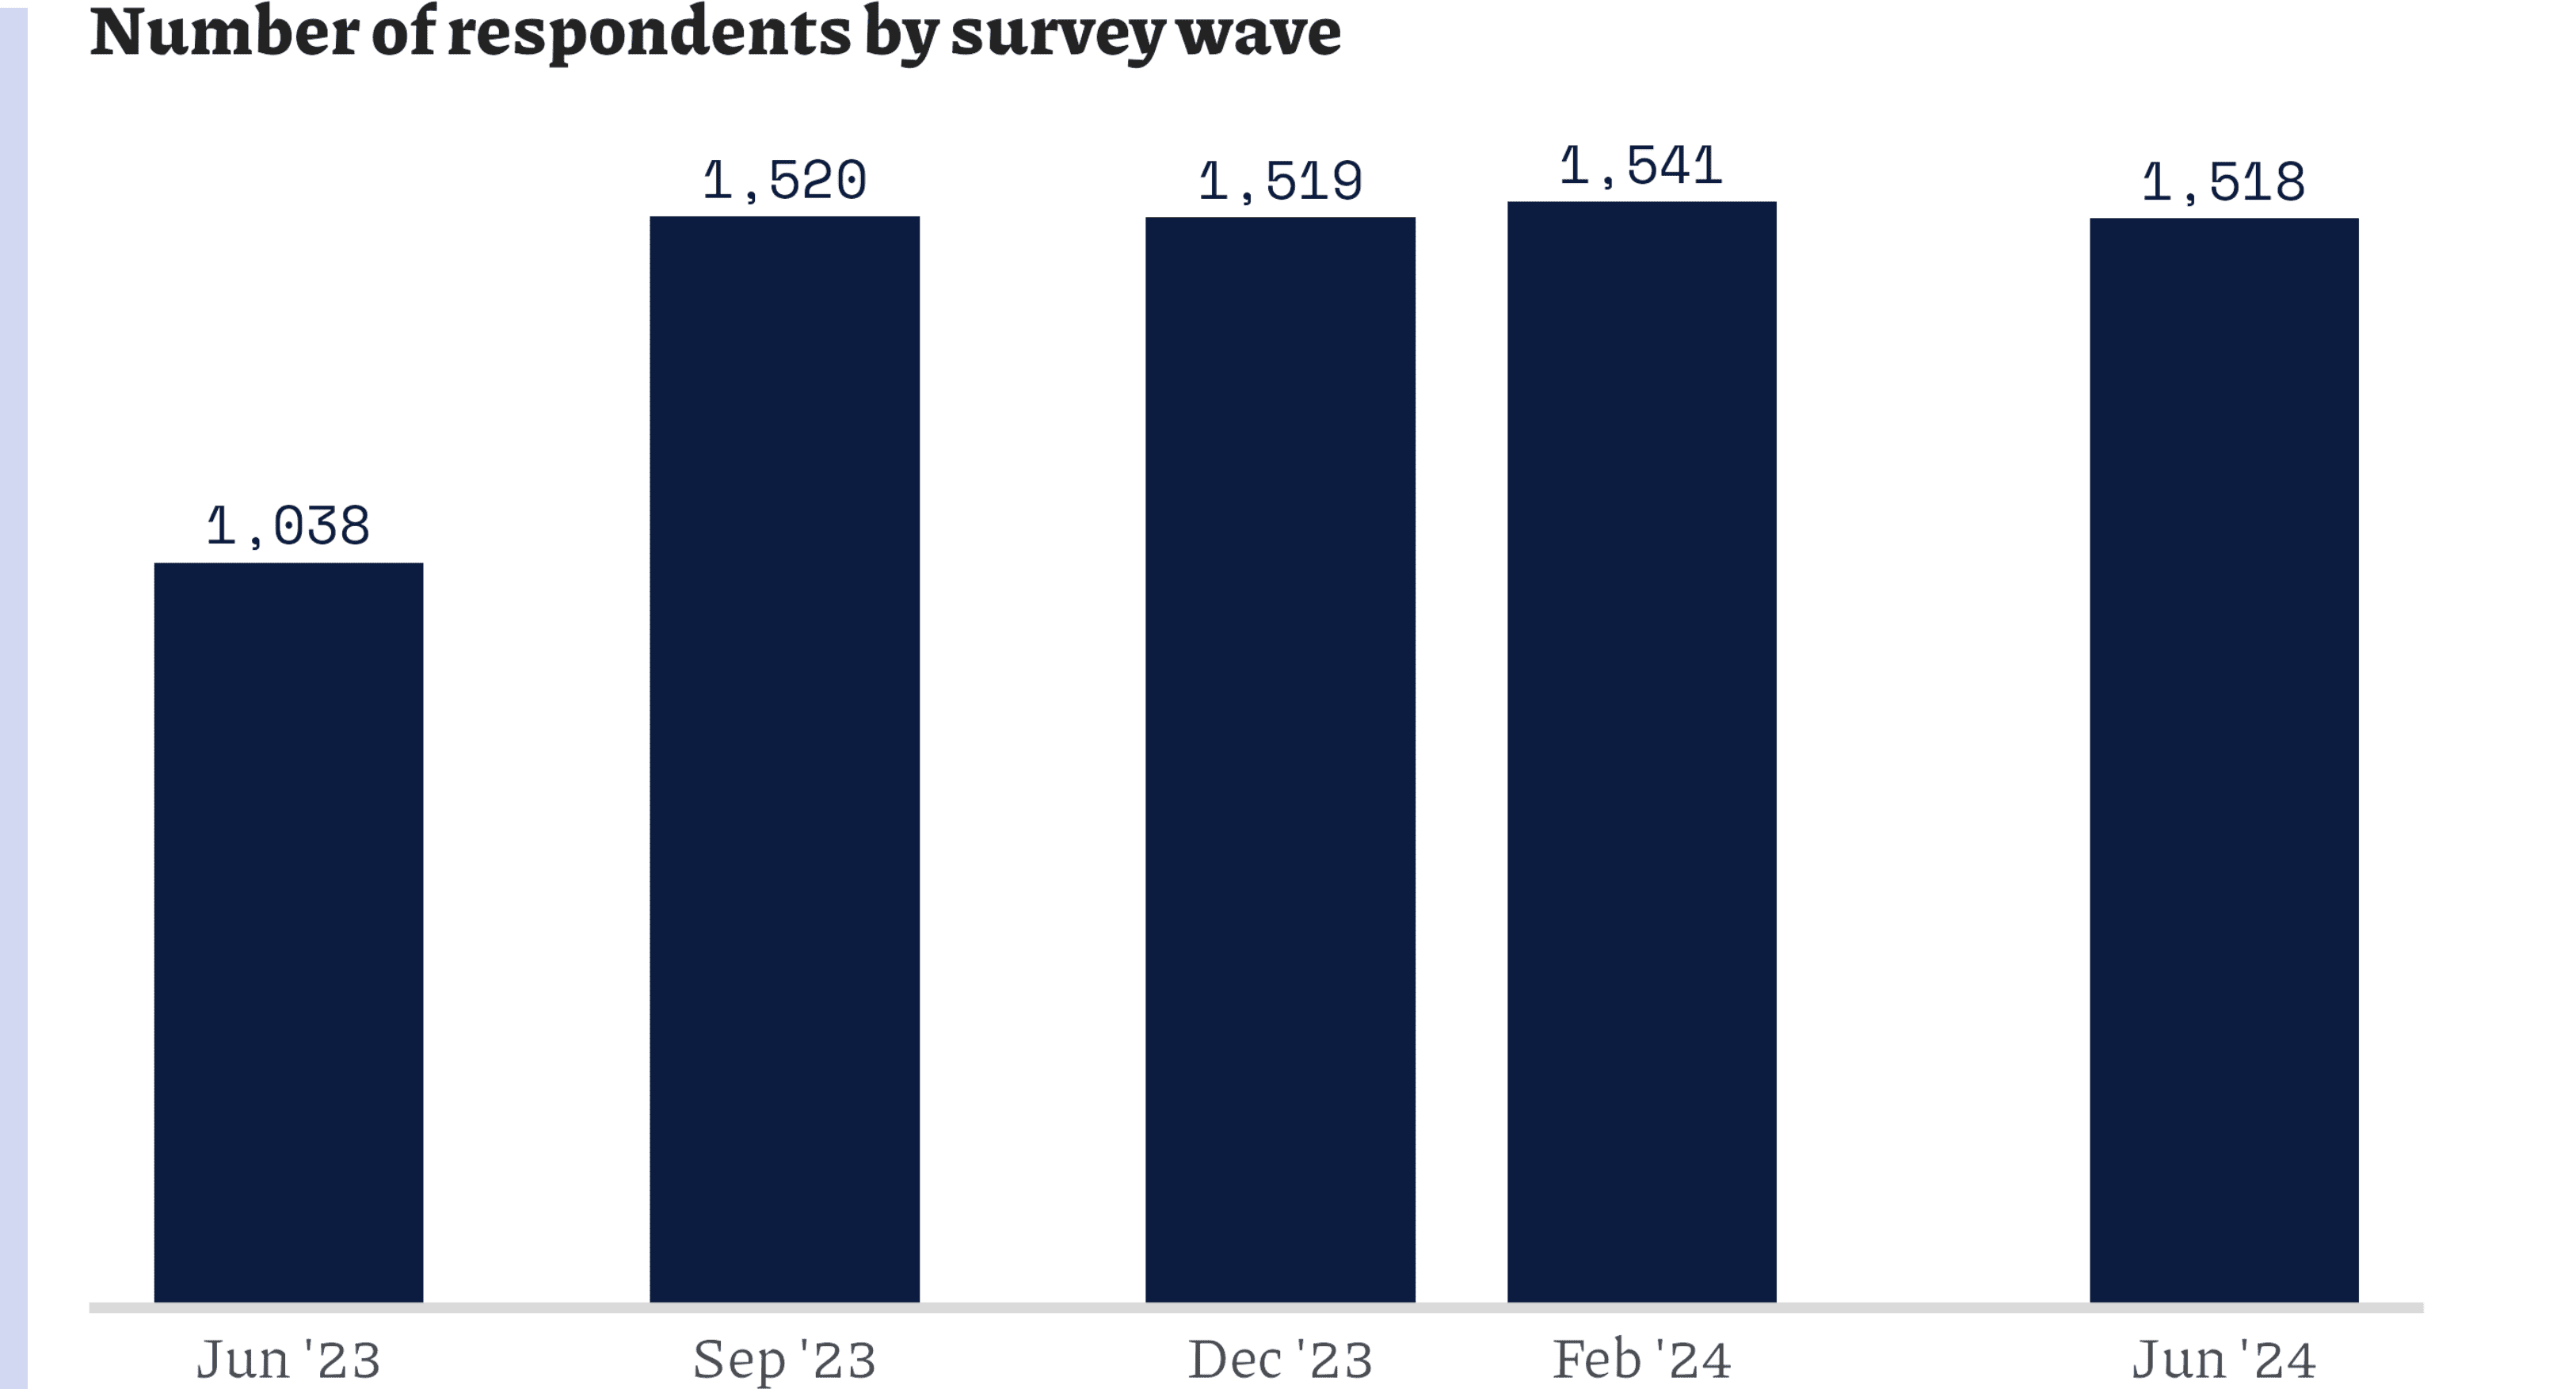
The data reported in this memo come from interviews with a total of 7,659 individuals across all five survey waves conducted on the internet of U.S. adults. Participants were drawn from YouGov’s online panel and were interviewed between June 14, 2023 and June 7, 2024. Respondents were selected to be representative of American adults. Responses were additionally weighted to match population characteristics with respect to gender, age, race/ethnicity, education of registered voters, and U.S. Census region based on voter registration lists, the U.S. Census American Community Survey, and the U.S. Census Current Population Survey, as well as 2020 presidential vote. The margin of error for these surveys ranges from approximately ± 2.7 to 3.5 percentage points, though it is larger for the analysis of partisan subgroups described above. Therefore, sample estimates should differ from their expected value by less than the margin of error in 95% of all samples. This figure does not reflect non-sampling errors, including potential selection bias in panel participation or measurement error.
Below, we present the number of survey respondents by wave.
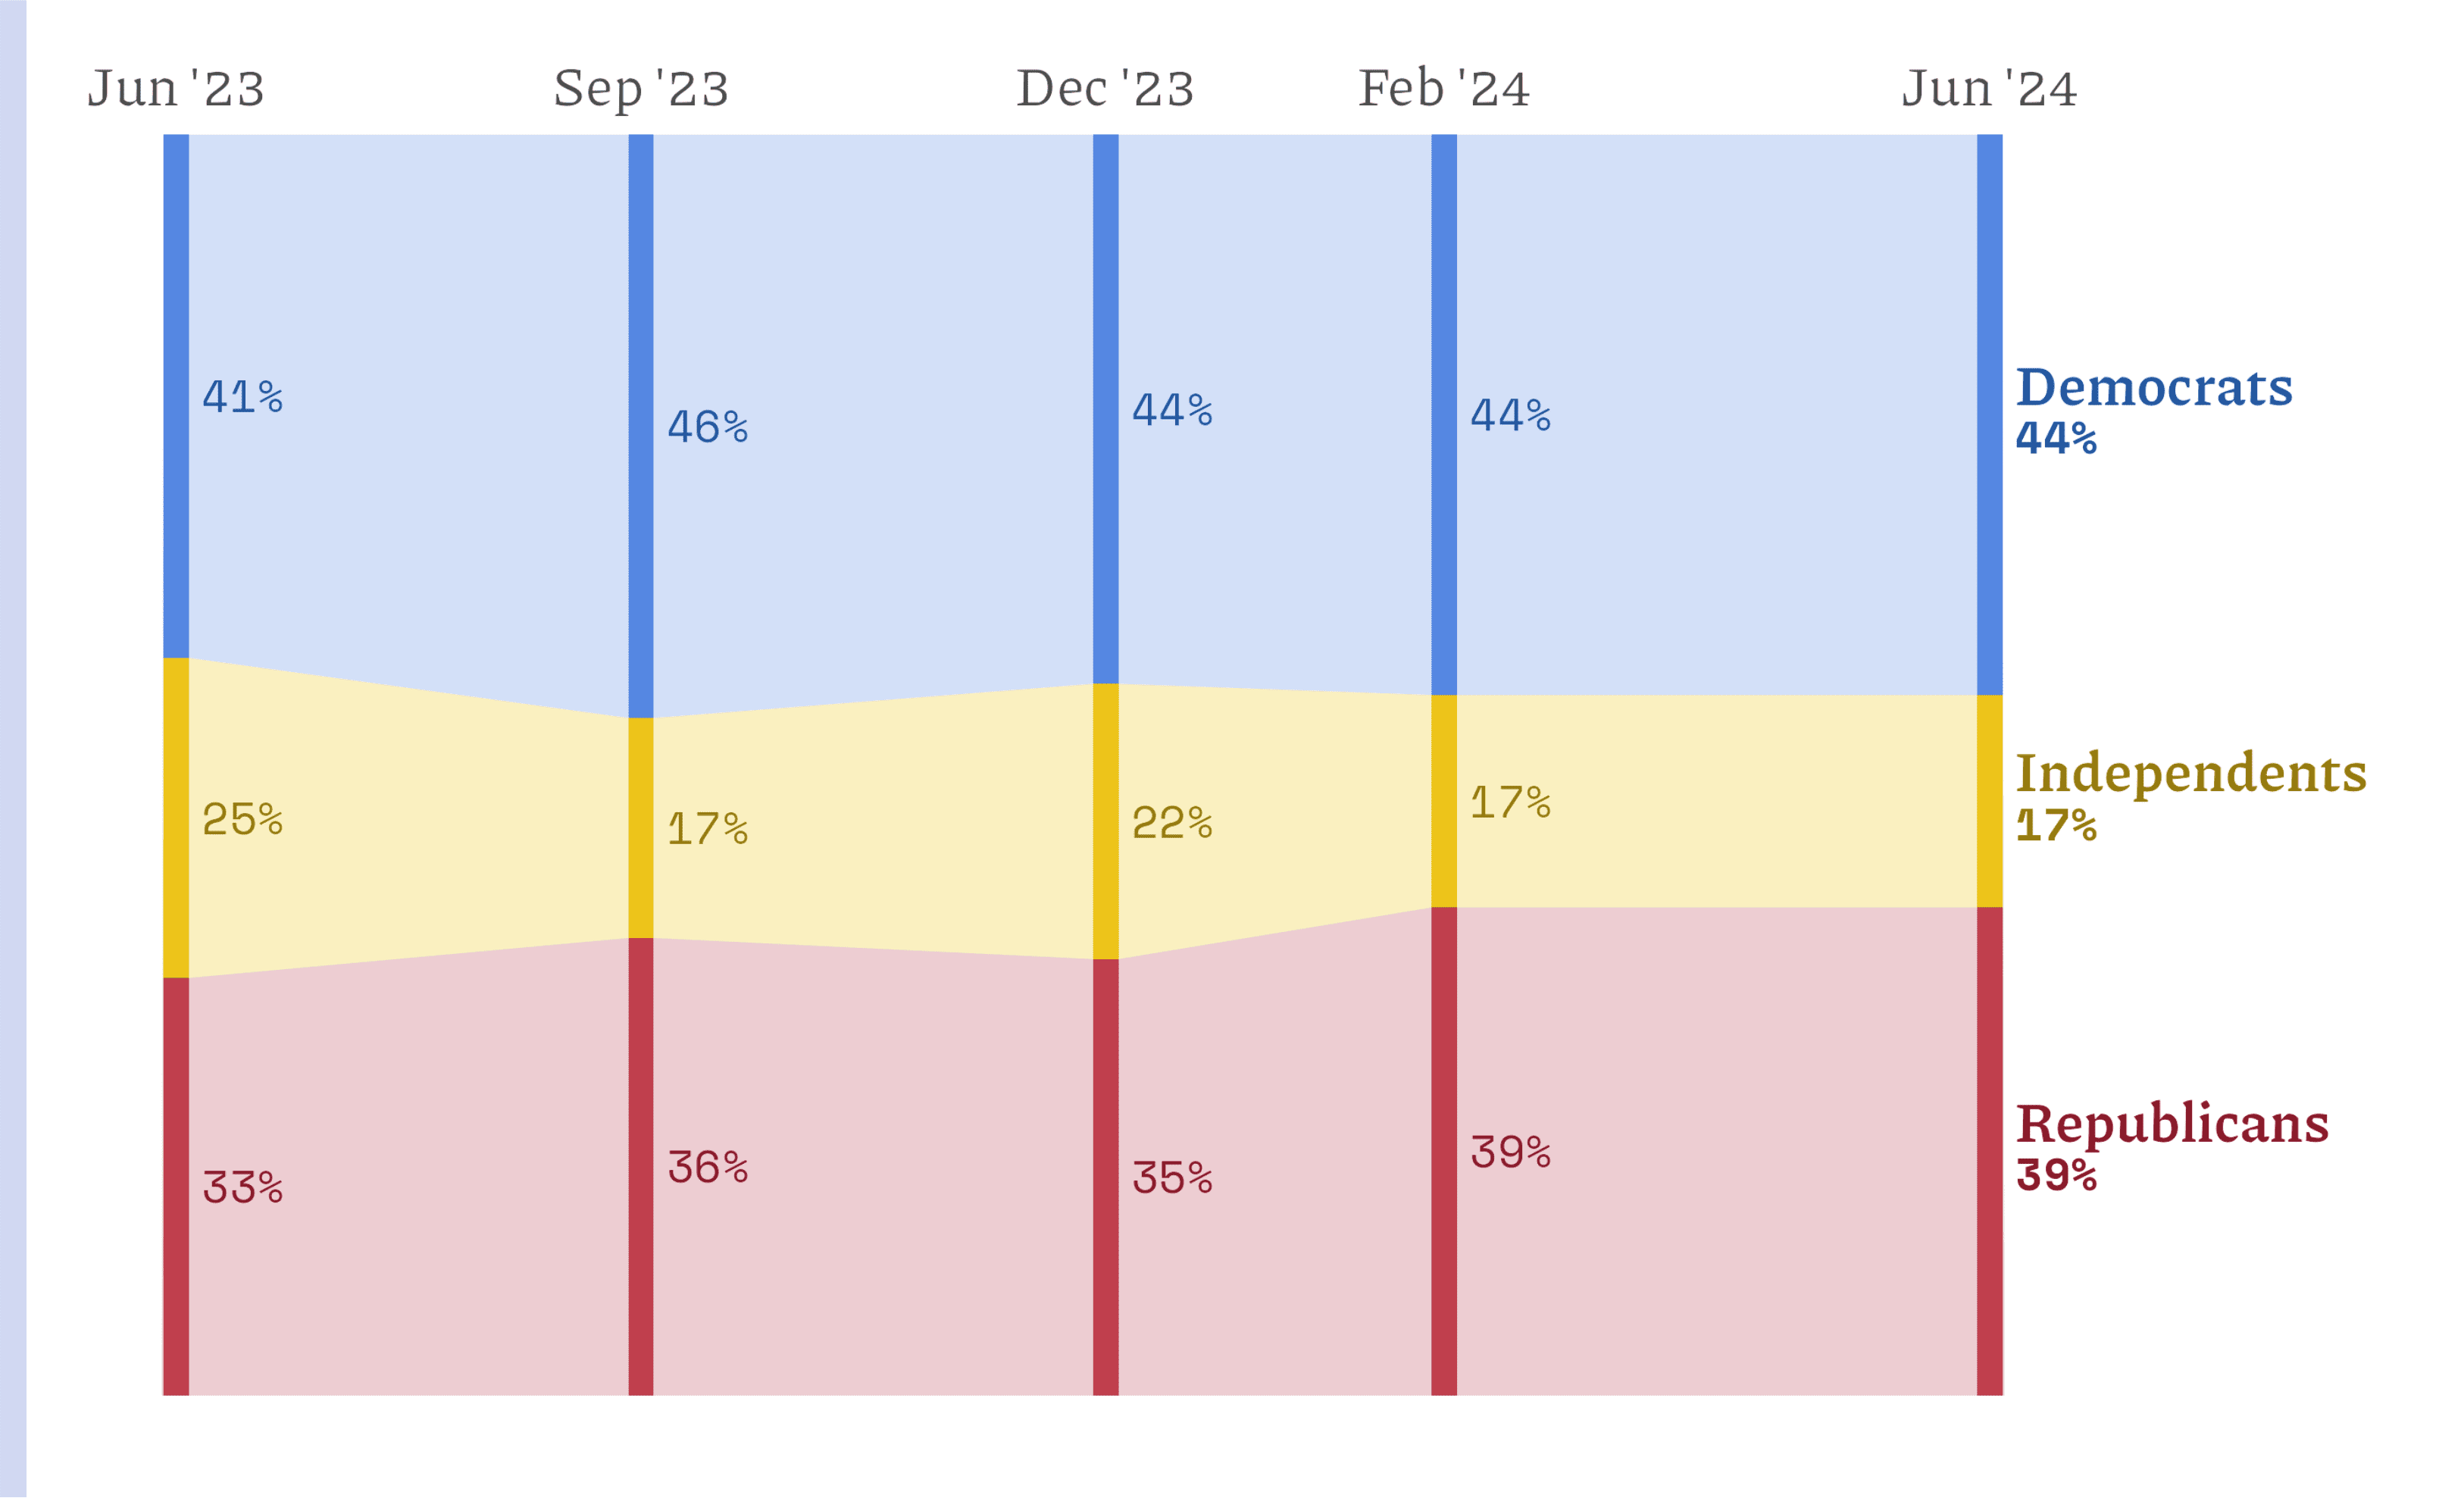
Partisanship Across Survey Waves
In keeping with best research practices, we classify independent voters who reported “leaning” toward either the Democratic or Republican parties as partisans. Therefore, we define “independents” as those respondents who professed no partisan attachments whatsoever. As shown below, our data includes responses from people from many people across the partisan spectrum.
